HelpDesk
How to Draw a Pareto Chart Using ConceptDraw PRO

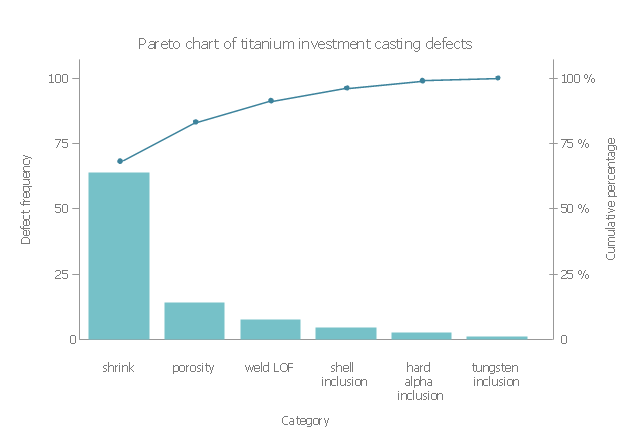
This example was redesigned from the Wikimedia Commons file: Pareto chart of titanium investment casting defects.svg.
[commons.wikimedia.org/ wiki/ File:Pareto_ chart_ of_ titanium_ investment_ casting_ defects.svg]
This file is licensed under the Creative Commons Attribution-Share Alike 3.0 Unported license. [creativecommons.org/ licenses/ by-sa/ 3.0/ deed.en]
"A Pareto chart, named after Vilfredo Pareto, is a type of chart that contains both bars and a line graph, where individual values are represented in descending order by bars, and the cumulative total is represented by the line.
The left vertical axis is the frequency of occurrence, but it can alternatively represent cost or another important unit of measure. The right vertical axis is the cumulative percentage of the total number of occurrences, total cost, or total of the particular unit of measure. Because the reasons are in decreasing order, the cumulative function is a concave function. ...
The Pareto chart is one of the seven basic tools of quality control." [Pareto chart. Wikipedia]
The Pareto chart example "Titanium investment casting defects" was created using the ConceptDraw PRO software extended with the Seven Basic Tools of Quality solution from the Quality area of ConceptDraw Solution Park.
Pareto chart example
Total Quality Management with ConceptDraw
 method - Fishbone diagram template")
 Seven Basic Tools of Quality
Manage quality control in the workplace, using fishbone diagrams, flowcharts, Pareto charts and histograms, provided by the Seven Basic Tools of Quality solution.
The vector stencils library "Process flowchart" contains 9 flow chart symbols.
Use it to design your process flowcharts with ConceptDraw PRO diagramming and vector drawing software.
"A flowchart is a type of diagram that represents an algorithm, workflow or process, showing the steps as boxes of various kinds, and their order by connecting them with arrows. ...
Kaoru Ishikawa defined the flowchart as one of the seven basic tools of quality control, next to the histogram, Pareto chart, check sheet, control chart, cause-and-effect diagram, and the scatter diagram. ...
Common alternative names include: flowchart, process flowchart, functional flowchart, process map, process chart, functional process chart, business process model, process model, process flow diagram, work flow diagram, business flow diagram. The terms "flowchart" and "flow chart" are used interchangeably." [Flowchart. Wikipedia]
The example of flow chart symbols "Design elements - Process flowchart" is included in the Seven Basic Tools of Quality solution from the Quality area of ConceptDraw Solution Park.
Process flowchart symbols

 Fault Tree Analysis Diagrams
This solution extends ConceptDraw PRO v9.5 or later with templates, fault tree analysis example, samples and a library of vector design elements for drawing FTA diagrams (or negative analytical trees), cause and effect diagrams and fault tree diagrams.
- Sales Process Flowchart. Flowchart Examples | Pareto Chart ...
- Pareto Chart | How to Draw a Pareto Chart Using ConceptDraw ...
- Seven Basic Tools of Quality | Pareto Chart | Technical drawing ...
- Bar Chart Software | Pareto Chart Online Generator
- Seven Basic Tools of Quality - Pareto Chart | Total Quality ...
- Pareto chart - Titanium investment casting defects | Examples of ...
- How to Draw a Pareto Chart Using ConceptDraw PRO | Seven Basic ...
- Sample Of Pareto Chart In Food And Beverage
- Seven Basic Tools of Quality - Pareto Chart | Pareto Chart ...