Seven Basic Tools of Quality - Pareto Chart

Pareto Chart

 Seven Basic Tools of Quality
Seven Basic Tools of Quality solution is useful for all ConceptDraw DIAGRAM users, giving them a particular set of different graphical techniques helping on focus on such activity as identifying the root cause of many quality-related issues. This solution offers the well-known visual tools helpful in representing all the data related to different quality initiatives. Some of such tools are the pre-made templates useful for making different fishbone diagrams, Pareto charts, and histograms. It is ideal for all who want to manage quality control throughout an organization by using a modern tool.
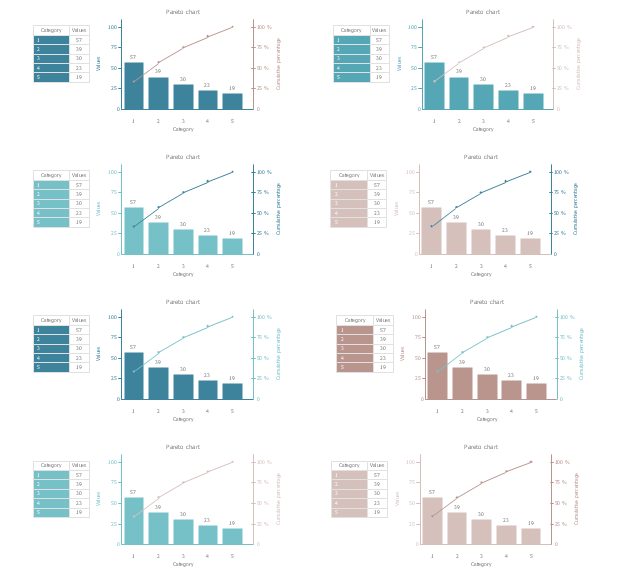
The vector stencils library "Pareto chart" contains 8 Pareto chart templates.
Use it to design your Pareto charts with ConceptDraw PRO diagramming and vector drawing software.
"A Pareto chart, named after Vilfredo Pareto, is a type of chart that contains both bars and a line graph, where individual values are represented in descending order by bars, and the cumulative total is represented by the line. ...
The Pareto chart is one of the seven basic tools of quality control." [Pareto chart. Wikipedia]
The example of diagram templates "Design elements - Pareto chart" is included in the Seven Basic Tools of Quality solution from the Quality area of ConceptDraw Solution Park.
Pareto chart templates
HelpDesk
How to Draw a Pareto Chart

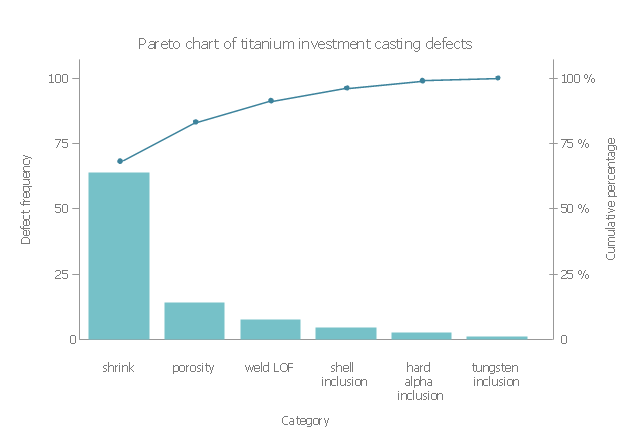
This example was redesigned from the Wikimedia Commons file: Pareto chart of titanium investment casting defects.svg.
[commons.wikimedia.org/ wiki/ File:Pareto_ chart_ of_ titanium_ investment_ casting_ defects.svg]
This file is licensed under the Creative Commons Attribution-Share Alike 3.0 Unported license. [creativecommons.org/ licenses/ by-sa/ 3.0/ deed.en]
"A Pareto chart, named after Vilfredo Pareto, is a type of chart that contains both bars and a line graph, where individual values are represented in descending order by bars, and the cumulative total is represented by the line.
The left vertical axis is the frequency of occurrence, but it can alternatively represent cost or another important unit of measure. The right vertical axis is the cumulative percentage of the total number of occurrences, total cost, or total of the particular unit of measure. Because the reasons are in decreasing order, the cumulative function is a concave function. ...
The Pareto chart is one of the seven basic tools of quality control." [Pareto chart. Wikipedia]
The Pareto chart example "Titanium investment casting defects" was created using the ConceptDraw PRO software extended with the Seven Basic Tools of Quality solution from the Quality area of ConceptDraw Solution Park.
Pareto chart example
Column Chart Template

Pareto Chart

Fishbone Problem Solving Tool

Seven Basic Tools of Quality — Quality Control

Bar Diagrams for Problem Solving. Create business management bar charts with Bar Graphs Solution

UML Software

eLearning for Leadership


 Business Diagrams Package
Business Diagrams Package is a large set of comprehensive graphical solutions from the ConceptDraw Solution Park, which are powerful in solving the business, marketing and quality tasks in completely different fields, such as finance, education, health food and cooking, HR, and many others. The tools of this package's solutions are a powerful assistant in drawing all diversity of Financial and Marketing infographics, Business process workflow diagrams, Organizational charts, Education infographics, Quality diagrams, Health food diagrams, HR flowcharts, as well as different graphics and charts, which depict the values of key business indicators, their dependencies, give the full understanding of a situation within a company and on the market.
Total Quality Management Definition

 Business Management Package
Business Management Package is a large set of graphical solutions from the ConceptDraw Solution Park. They are selected to help in solving the business, management, marketing and quality tasks in a best way. It is useful for many management specialists, marketing experts, business specialists, international business experts, IT managers, specialists in managing the business processes, financial specialists, and other business related specialists. Create documents, reports, statistical summaries, describe business processes, build business models for many fields including finance, education, logistic, landscape design, health, cooking, and many more.
Business Package for Management
Package intended for professional who designing and documenting business processes, preparing business reports, plan projects and manage projects, manage organizational changes, prepare operational instructions, supervising specific department of an organization, workout customer service processes and prepare trainings for customer service personal, carry out a variety of duties to organize business workflow.
The library of vector stencils "Fishbone diagrams" contains 13 symbols for drawing the Ishikawa diagrams using the ConceptDraw PRO diagramming and vector drawing software.
"Ishikawa diagrams were popularized by Kaoru Ishikawa in the 1960s, who pioneered quality management processes in the Kawasaki shipyards, and in the process became one of the founding fathers of modern management.
The basic concept was first used in the 1920s, and is considered one of the seven basic tools of quality control. It is known as a fishbone diagram because of its shape, similar to the side view of a fish skeleton." [Ishikawa diagram. Wikipedia]
"The Seven Basic Tools of Quality is a designation given to a fixed set of graphical techniques identified as being most helpful in troubleshooting issues related to quality. They are called basic because they are suitable for people with little formal training in statistics and because they can be used to solve the vast majority of quality-related issues.
The seven tools are:
(1) Cause-and-effect diagram (also known as the "fishbone" or Ishikawa diagram);
(2) Check sheet;
(3) Control chart;
(4) Histogram;
(5) Pareto chart;
(6) Scatter diagram;
(7) Stratification (alternately, flow chart or run chart)." [Seven Basic Tools of Quality. Wikipedia]
The example "Design elements - Fishbone diagram" is included in the Fishbone Diagrams solution from the Management area of ConceptDraw Solution Park.
Ishikawa diagram symbols

Total Quality Management Value

Seven Basic Tools of Quality - Fishbone Diagram

- How to Draw a Pareto Chart Using ConceptDraw PRO | Seven Basic ...
- Seven Basic Tools of Quality | How to Draw a Pareto Chart Using ...
- Design elements - Process flowchart | How to Draw a Pareto Chart ...
- How to Draw a Pareto Chart Using ConceptDraw PRO | Design ...
- Plan-Do-Check-Act (PDCA) | Pareto Chart | Total Quality ...
- PM Personal Time Management | Schedule pie chart | Pareto Chart
- How to Draw a Pareto Chart Using ConceptDraw PRO | How to ...
- Column Chart Template | Scatter Chart Examples | Bar Chart Software
- How to Draw a Pareto Chart | Seven Basic Tools of Quality - Pareto ...