Mechanical Drawing Symbols

Pareto Chart

UML Use Case Diagram Example. Social Networking Sites Project

 Seven Basic Tools of Quality
Manage quality control in the workplace, using fishbone diagrams, flowcharts, Pareto charts and histograms, provided by the Seven Basic Tools of Quality solution.
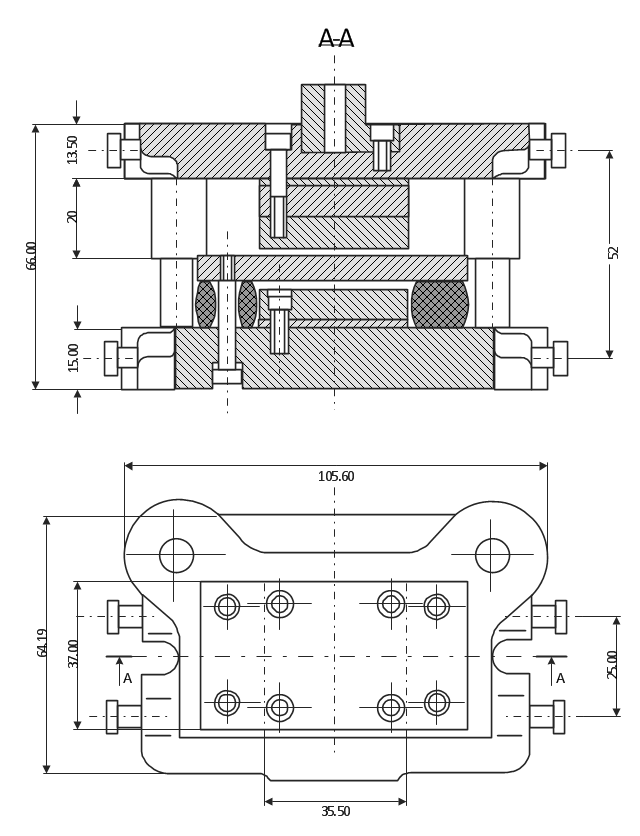
This technical drawing shows the machine parts assembly using joining by threaded fasteners.
"Assembling (joining of the pieces) is done by welding, binding with adhesives, riveting, threaded fasteners, or even yet more bending in the form of a crimped seam. Structural steel and sheet metal are the usual starting materials for fabrication, along with the welding wire, flux, and fasteners that will join the cut pieces. As with other manufacturing processes, both human labor and automation are commonly used. The product resulting from fabrication may be called a fabrication. Shops that specialize in this type of metal work are called fab shops. The end products of other common types of metalworking, such as machining, metal stamping, forging, and casting, may be similar in shape and function, but those processes are not classified as fabrication." [Metal fabrication. Wikipedia]
This mechanical engineering drawing example was designed using ConceptDraw PRO diagramming and vector drawing software extended with Mechanical Engineering solution from Engineering area of ConceptDraw Solution Park.
Cause and Effect Analysis


"The Process Flow Chart provides a visual representation of the steps in a process. ...
When to Use:
One of the first activities of a process improvement effort is constructing a flowchart. It provides the following benefits:
1- It give you and everyone a clear understanding of the process.
2- Facilitates teamwork and communication.
3- Helps to identify non-value-added operations."
[bexcellence.org/ Flow-Chart.html]
This TQM diagram example shows a business process that can be then analyzed to improve the effectiveness and diagnose quality issues that require resolution.
This example was created using the ConceptDraw PRO diagramming and vector drawing software extended with the Total Quality Management (TQM) Diagrams solution from the Quality area of ConceptDraw Solution Park.
TQM diagram

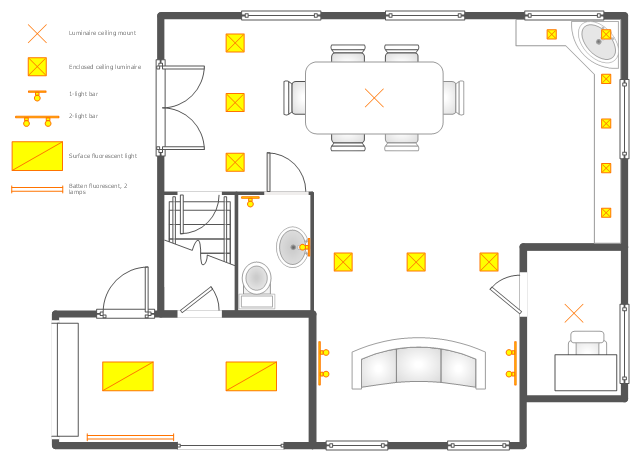
This reflected ceiling plan (RCP) sample depicts the ground floor lighting scheme.
"Downlighting is most common, with fixtures on or recessed in the ceiling casting light downward. This tends to be the most used method, used in both offices and homes. Although it is easy to design it has dramatic problems with glare and excess energy consumption due to large number of fittings. The introduction of LED lighting has greatly improved this by approx. 90% when compared to a halogen downlight or spotlight. LED lamps or bulbs are now available to retro fit in place of high energy consumption lamps.
" [Lighting. Wikipedia]
The lighting scheme example "Ground floor RCP" was created using the ConceptDraw DIAGRAM diagramming and vector drawing software extended with the Reflected Ceiling Plans solution from the Building Plans area of ConceptDraw Solution Park.
Lighting sheme
"Ishikawa diagrams (also called fishbone diagrams, herringbone diagrams, cause-and-effect diagrams, or Fishikawa) are causal diagrams created by Kaoru Ishikawa (1968) that show the causes of a specific event. Common uses of the Ishikawa diagram are product design and quality defect prevention, to identify potential factors causing an overall effect. Each cause or reason for imperfection is a source of variation. Causes are usually grouped into major categories to identify these sources of variation. The categories typically include:
- People: Anyone involved with the process
- Methods: How the process is performed and the specific requirements for doing it, such as policies, procedures, rules, regulations and laws
- Machines: Any equipment, computers, tools, etc. required to accomplish the job
- Materials: Raw materials, parts, pens, paper, etc. used to produce the final product
- Measurements: Data generated from the process that are used to evaluate its quality
- Environment: The conditions, such as location, time, temperature, and culture in which the process operates" [Ishikawa diagram. Wikipedia]
The fishbone diagram example "Causes of low-quality output" was created using the ConceptDraw PRO diagramming and vector drawing software extended with the Fishbone Diagrams solution from the Management area of ConceptDraw Solution Park.
Ishikawa diagram

- Technical drawing - Machine parts assembling | Casting Drawings ...
- Casting Drawing Vs Machining Drawing
- Drawing Machine Casting
- Symbols Used In Casting And Forging
- Casting Drawings In Engineering
- Mechanical Engineering | Mechanical Product Drawing Example
- Pareto chart - Titanium investment casting defects | Pareto Chart ...
- Technical drawing - Machine parts assembling | Welding symbols ...
- How to Draw a Pareto Chart Using ConceptDraw PRO | Pareto chart ...