This example was redesigned from the Wikimedia Commons file: Pareto chart of titanium investment casting defects.svg.
[commons.wikimedia.org/ wiki/ File:Pareto_ chart_ of_ titanium_ investment_ casting_ defects.svg]
This file is licensed under the Creative Commons Attribution-Share Alike 3.0 Unported license. [creativecommons.org/ licenses/ by-sa/ 3.0/ deed.en]
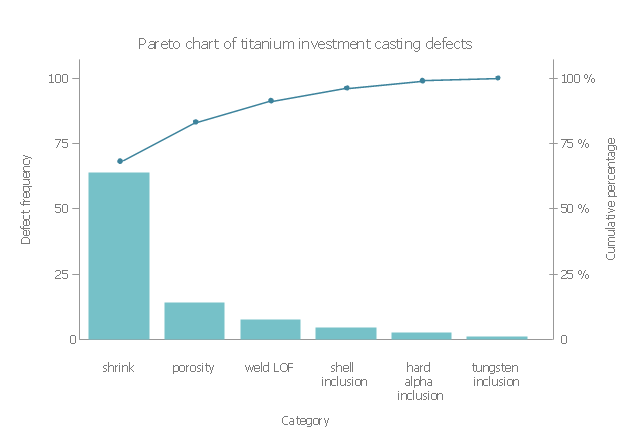
"A Pareto chart, named after Vilfredo Pareto, is a type of chart that contains both bars and a line graph, where individual values are represented in descending order by bars, and the cumulative total is represented by the line.
The left vertical axis is the frequency of occurrence, but it can alternatively represent cost or another important unit of measure. The right vertical axis is the cumulative percentage of the total number of occurrences, total cost, or total of the particular unit of measure. Because the reasons are in decreasing order, the cumulative function is a concave function. ...
The Pareto chart is one of the seven basic tools of quality control." [Pareto chart. Wikipedia]
The Pareto chart example "Titanium investment casting defects" was created using the ConceptDraw PRO software extended with the Seven Basic Tools of Quality solution from the Quality area of ConceptDraw Solution Park.
[commons.wikimedia.org/ wiki/ File:Pareto_ chart_ of_ titanium_ investment_ casting_ defects.svg]
This file is licensed under the Creative Commons Attribution-Share Alike 3.0 Unported license. [creativecommons.org/ licenses/ by-sa/ 3.0/ deed.en]
"A Pareto chart, named after Vilfredo Pareto, is a type of chart that contains both bars and a line graph, where individual values are represented in descending order by bars, and the cumulative total is represented by the line.
The left vertical axis is the frequency of occurrence, but it can alternatively represent cost or another important unit of measure. The right vertical axis is the cumulative percentage of the total number of occurrences, total cost, or total of the particular unit of measure. Because the reasons are in decreasing order, the cumulative function is a concave function. ...
The Pareto chart is one of the seven basic tools of quality control." [Pareto chart. Wikipedia]
The Pareto chart example "Titanium investment casting defects" was created using the ConceptDraw PRO software extended with the Seven Basic Tools of Quality solution from the Quality area of ConceptDraw Solution Park.
Pareto chart example
Pareto Chart

Seven Basic Tools of Quality - Pareto Chart

 Seven Basic Tools of Quality
Manage quality control in the workplace, using fishbone diagrams, flowcharts, Pareto charts and histograms, provided by the Seven Basic Tools of Quality solution.
- Pareto chart - Titanium investment casting defects | Pyramid ...
- Pareto chart - Titanium investment casting defects
- Pareto chart - Titanium investment casting defects | Examples of ...
- Casting Drawing Example
- How to Draw a Pareto Chart Using ConceptDraw PRO | Pareto ...
- Pareto Chart | How to Draw a Pareto Chart Using ConceptDraw ...
- Investment Vector Png For Ppt
- Easy To Draw Titanium Element
- Investment Png
- Sales Process Flowchart. Flowchart Examples | Pareto Chart ...
- Total Quality Management with ConceptDraw | Seven Basic Tools of ...
- Flow Chart Investment Account
- Process Flowchart | Simple Flow Chart | Pareto Chart | A Chart That ...
- Investment Logo Png Vector
- Total Quality Management with ConceptDraw | Cause and Effect ...
- Investment Management Png
- Investment Png Vector
- Investment Vector
- Schedule pie chart - Daily action plan | Pyramid Diagram | PM ...
- Bar Diagrams for Problem Solving. Create business management ...