How To Use Collaboration Tool in Project Management


Local area network (LAN). Computer and Network Examples
 diagram")

 Seven Management and Planning Tools
Seven Management and Planning Tools solution extends ConceptDraw DIAGRAM and ConceptDraw MINDMAP with features, templates, samples and libraries of vector stencils for drawing management mind maps and diagrams.
Flowchart Example: Flow Chart of Marketing Analysis

Basic Workflow Examples

Accounting Flowchart Symbols

Decision Making Software For Small Business

This SWOT matrix diagram example was created on the base of article "An Easy Way To Jumpstart Your Strategic Plan: SWOT" by Leslie Wolf from the website of the California Digital Library, the University of California. "Strategic planning doesn’t have to be a daunting and lengthy process. The goal is really a simple one: to help you understand your world and build a road map to guide your efforts. ...
This analysis tool can help you focus your attention on the specific success factors that are right for your team.
The tool is called a SWOT analysis. SWOT stands for Strengths and Weaknesses, Opportunities and Threats. Here’s what it means:
(1) Strengths are those positive internal attributes that strengthen your business or team. You can develop plans to capitalize on those strengths.
(2) Weaknesses are those negative internal attributes that are working against your success. You can shore up those weaknesses so they don’t stop your success.
(3) Opportunities are those external conditions that can have a positive effect on your goals. These opportunities can point you in the right direction.
(4) Threats are those external conditions that can have a negative effect on your goals. These threats will affect you less if you can identify and minimize them. ...
We thought it would be helpful to show you a sample SWOT analysis for a business you can easily visualize: a small independent bookstore in a university town. The store owner brought the team together to think about how the bookstore could survive during the continuing financial downturn. After an hour of brainstorming, this is the SWOT analysis they developed." [cdlib.org/ cdlinfo/ 2010/ 09/ 29/ an-easy-way-to-jumpstart-your-strategic-plan-swot/ ]
The matrix diagram example "SWOT analysis for a small independent bookstore" was created using the ConceptDraw PRO diagramming and vector drawing software extended with the SWOT Analysis solution from the Management area of ConceptDraw Solution Park.
SWOT matrix

Network Diagramming Software for Network Active Directory Diagrams

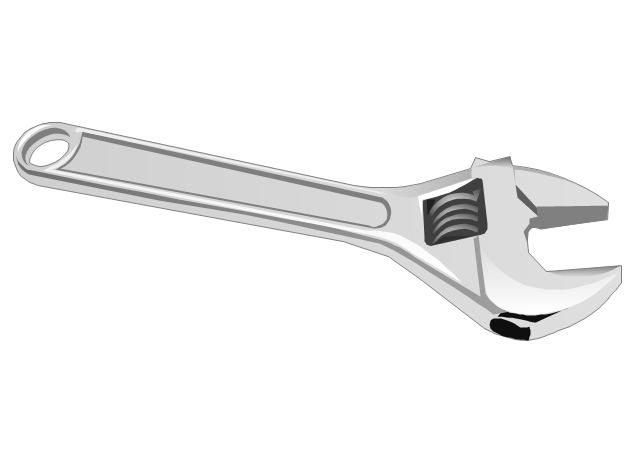
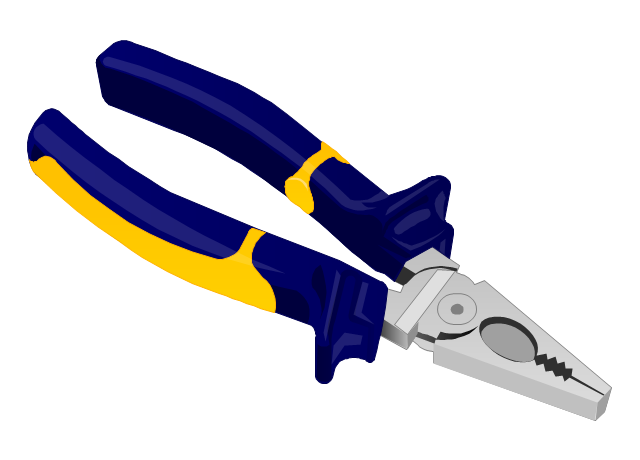
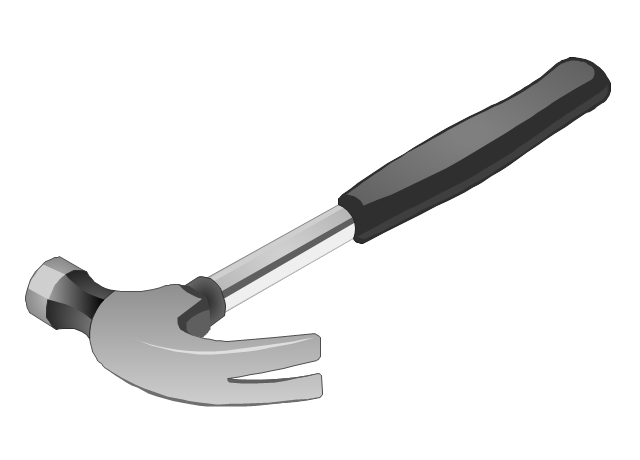
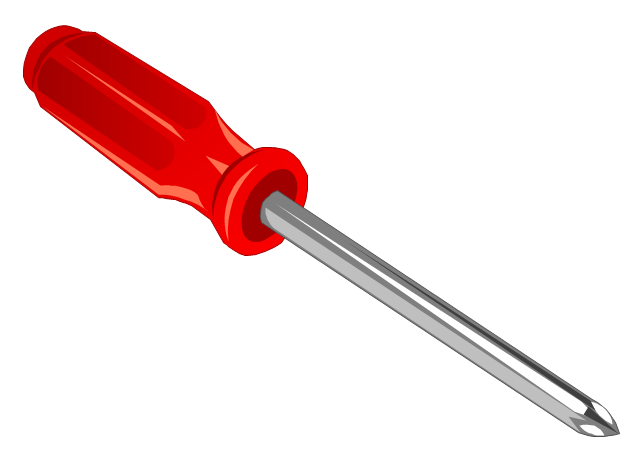
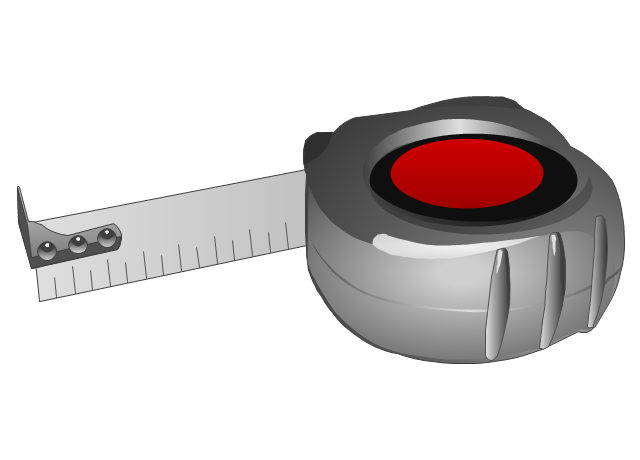
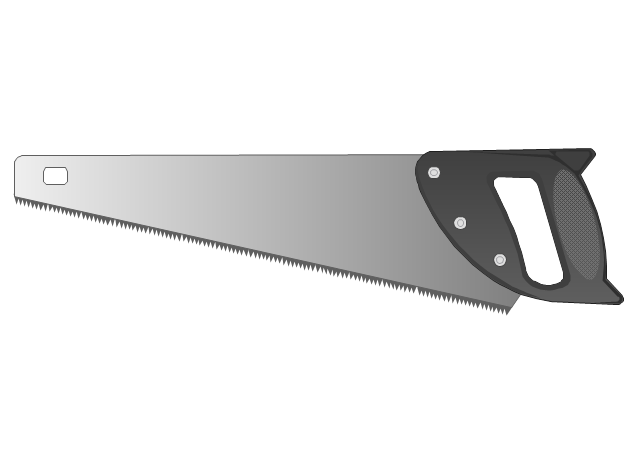
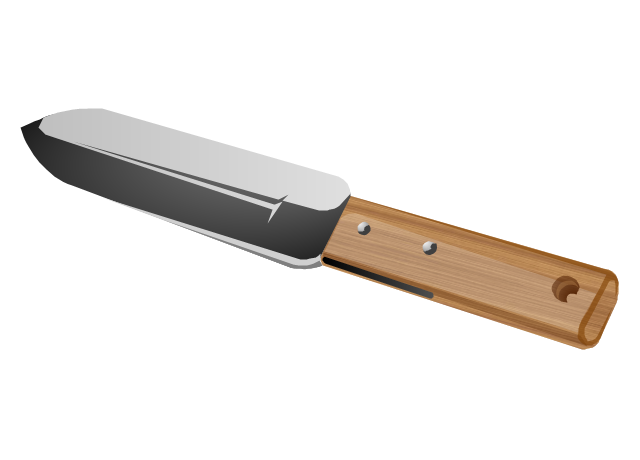
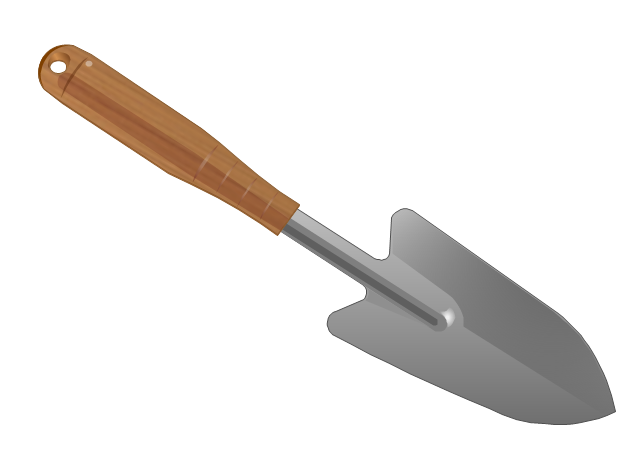
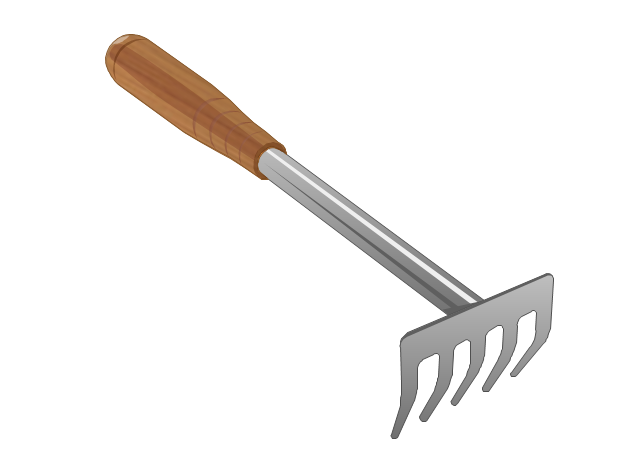
The vector stencils library "Tools" contains 11 clipart images of hand tools and instruments for drawing illustrations.
"A tool is any physical item that can be used to achieve a goal, especially if the item is not consumed in the process. Informally the word is also used to describe a procedure or process with a specific purpose. Tool use by humans dates back millions of years, and other animals are also known to employ simple tools.
Tools that are used in particular fields or activities may have different designations such as "instrument", "utensil", "implement", "machine", or "apparatus". The set of tools needed to achieve a goal is "equipment". The knowledge of constructing, obtaining and using tools is technology." [Tool. Wikipedia]
The clip art example "Tools - Vector stencils library" was created in ConceptDraw PRO diagramming and vector drawing software using the Manufacturing and Maintenance solution from the Illustration area of ConceptDraw Solution Park.
Adjustable spanner
Lineman's pliers
Claw hammer
Phillips screwdriver
Self-retracting tape measure
Crosscut hand saw
Nail

Hori-Hori garden knife
Gardening trowel
Garden rake
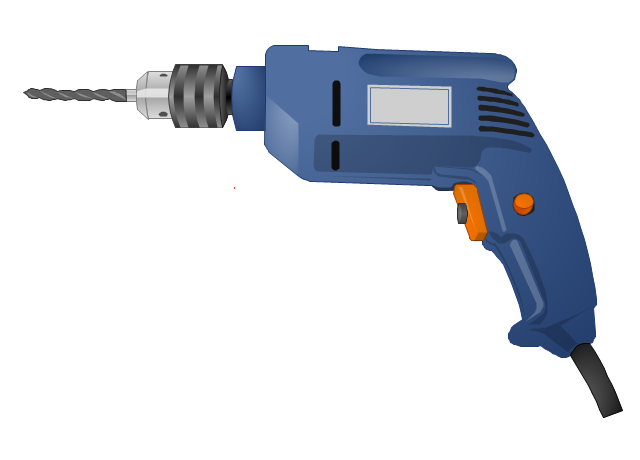
Pistol-grip electric drill
Maps and Directions

Venn Diagram Examples for Problem Solving. Environmental Social Science. Human Sustainability Confluence

Create Organizational Chart

How To Make a Concept Map

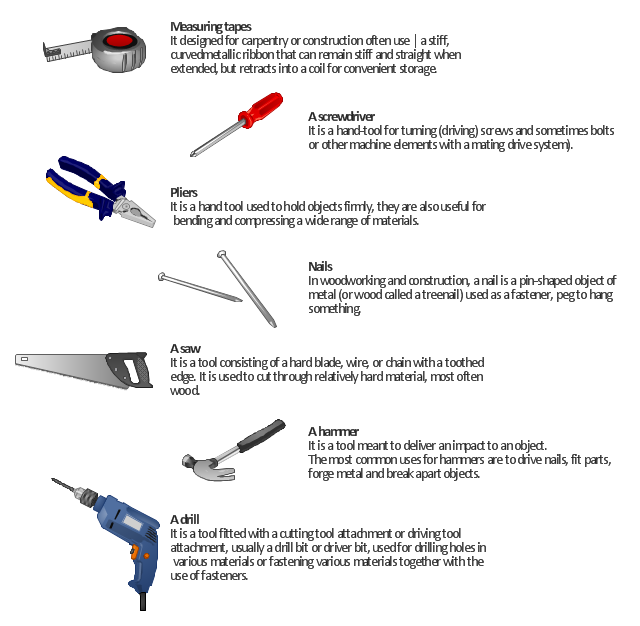
"A hand tool is any tool that is not a power tool – that is, one powered by hand (manual labour) rather than by an engine. Some examples of hand tools are hammers, spanners, pliers, screwdrivers and chisels. Hand tools are generally less dangerous than power tools." [Hand tool. Wikipedia]
"A power tool is a tool that is actuated by an additional power source and mechanism other than the solely manual labour used with hand tools. The most common types of power tools use electric motors. ...
Power tools are used in industry, in construction, in the garden, for housework tasks such as cooking, cleaning, and around the house for purposes of driving (fasteners), drilling, cutting, shaping, sanding, grinding, routing, polishing, painting, heating and more.
Power tools are classified as either stationary or portable, where portable means hand-held. Portable power tools have obvious advantages in mobility." [Power tool. Wikipedia]
The illustration example "7 tools that should be in every home" was created in the ConceptDraw PRO diagramming and vector drawing software using the Manufacturing and Maintenance solution from the Illustration area of ConceptDraw Solution Park.
Infographics
Pyramid Diagram

Social Media Flowchart Symbols

Fishbone Diagram Problem Solving

Concept Map

Concept Mapping

- Tools - Vector stencils library | 7 tools that should be in every home ...
- Pict Page1 Physical Lan And Wan Diagram Template Png Draw
- Fifa World Cup Pict
- Tools - Vector stencils library | Masonry Tools And Their Uses With ...
- Cooking Recipes | Holiday Recipes | Dinner Recipes | Examples Of ...
- Tools - Vector stencils library | Diagram Of Hammer And Pliers And ...
- Plier Is Not A Process Tools For Tqm Systems
- Tools - Vector stencils library | Draw And Label A Hand Trowel
- Tools - Vector stencils library | Machines and equipment - Vector ...
- Acetato di etile | Cafe and Restaurant Floor Plans | Cause and effect ...
- Cab booking public process - Collaboration BPMN 2.0 diagram ...
- Hand Movements Pict
- 7 tools that should be in every home | Example Of Hand Tools And ...
- Stratification Quality Tool Example
- Design elements - Audit flowchart | Audit process flowchart ...
- Design elements - Azure architecture - Microsoft products | Windows ...
- Tqm Flowchart Example
- Seven Basic Tools of Quality | Stratification diagram example ...
- Seven Management and Planning Tools | Seven Basic Tools of ...