HelpDesk
How to Create a Timeline Diagram in ConceptDraw PRO

 Timeline Diagrams
Timeline Diagrams solution extends ConceptDraw PRO diagramming software with samples, templates and libraries of specially developed smart vector design elements of timeline bars, time intervals, milestones, events, today marker, legend, and many other elements with custom properties, helpful for professional drawing clear and intuitive Timeline Diagrams. Use it to design simple Timeline Diagrams and designate only the main project stages, or highly detailed Timeline Diagrams depicting all project tasks, subtasks, milestones, deadlines, responsible persons and other description information, ideal for applying in presentations, reports, education materials, and other documentation.
Timeline Diagrams

How to Make a Timeline

Timeline Examples

Project Timeline

 Business Processes
Business Process solution extends ConceptDraw PRO software with business process diagrams as cross-functional flowcharts, workflows, process charts, IDEF0, timelines, calendars, Gantt charts, business process modeling, audit and opportunity flowcharts.
 Marketing
This solution extends ConceptDraw PRO v9 and ConceptDraw MINDMAP v7 with Marketing Diagrams and Mind Maps (brainstorming, preparing and holding meetings and presentations, sales calls).
 Management
This solution extends ConceptDraw PRO v9 and ConceptDraw MINDMAP v7 with Management Diagrams and Mind Maps (decision making, scheduling, thinking ideas, problem solving, business planning, company organizing, SWOT analysis, preparing and holding meetings
 Quality
This solution extends ConceptDraw PRO v9 and ConceptDraw MINDMAP v7 with Quality Management Diagrams (Total Quality Management Diagrams, Timelines, Workflows, Value Stream Maps) and Mind Maps (Presentations, Meeting Agendas, Problem to be solved).
How to Report Task's Execution with Gantt Chart

 PM Easy
PM Easy solution extends the ConceptDraw PROJECT functionality with an ability to support neutral methodology of project management and to quickly start a project by listing the task relationships and dependencies, that makes the iterative planning much easier. The project management tool and available visual tools, such as mind mapping, increase the effectiveness of tracking and analysis your project tasks. PM Easy solution from ConceptDraw Solution Park is mainly targeted at project managers in small or medium-sized companies, allowing them to make the project plan and execute projects using mind mapping technique, to implement planning using mind mapping, and to track tasks using ConceptDraw PROJECT application.
Line Chart Examples

 Line Graphs
How to draw a Line Graph with ease? The Line Graphs solution extends the capabilities of ConceptDraw PRO v10 with professionally designed templates, samples, and a library of vector stencils for drawing perfect Line Graphs.
 Management Area
The solutions from Management area of ConceptDraw Solution Park collect templates, samples and libraries of vector stencils for drawing the management diagrams and mind maps.
Line Chart Template for Word

Basic Flowchart Symbols and Meaning


Create Organizational Chart

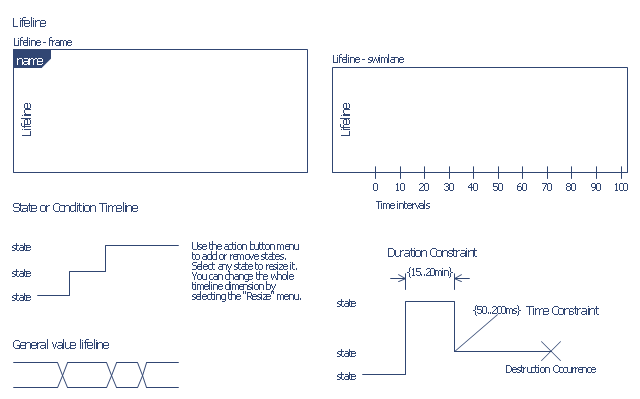
The vector stencils library "Bank UML timing diagram" contains 8 shapes for drawing UML timing diagrams.
Use it for object-oriented modeling of your bank information system.
"A timing diagram in the Unified Modeling Language 2.0 is a specific type of interaction diagram, where the focus is on timing constraints.
Timing diagrams are used to explore the behaviors of objects throughout a given period of time. A timing diagram is a special form of a sequence diagram. The differences between timing diagram and sequence diagram are the axes are reversed so that the time is increased from left to right and the lifelines are shown in separate compartments arranged vertically.
There are two basic flavors of timing diagram: the concise notation, and the robust notation." [Timing diagram. Wikipedia]
This example of UML timing diagram symbols for the ConceptDraw PRO diagramming and vector drawing software is included in the ATM UML Diagrams solution from the Software Development area of ConceptDraw Solution Park.
UML timing diagram symbols
- Timeline Diagrams | How to Create a Timeline Diagram in ...
- Timeline Diagrams | Timeline Examples | How to Create a Timeline ...
- How to Create a Timeline Diagram in ConceptDraw PRO | Business ...
- How to Create a Timeline Diagram in ConceptDraw PRO | How to ...
- How to Create a Timeline Diagram in ConceptDraw PRO | Timeline ...
- How to Make a Timeline | How to Create a Timeline Diagram in ...
- Project timeline diagram - New business project plan | Project plan ...
- Timeline Diagrams | How to Make a Timeline | How to Create a ...
- Timeline Diagrams
- Project timeline diagram
- How to Make a Timeline | Timeline Diagrams | Project Timeline ...
- Project Timeline | Gantt Chart Software | Timeline Diagrams | Project ...
- Project timeline diagram - New business project plan | How to ...
- Project Timeline | How to Make a Timeline | Timeline Diagrams ...
- Timeline Diagrams | Timeline Diagrams | Area Charts | Sample Of A ...
- Timeline Examples | How to Create a Timeline Diagram in ...
- Project timeline diagram - New business project plan | Timeline ...
- Timeline Diagrams
- Business diagrams & Org Charts with ConceptDraw PRO | Timeline ...
- Communication Tool for Remote Project Management | Project ...