Timeline Examples

HelpDesk
How to Create a Timeline Diagram

 Timeline Diagrams
Timeline Diagrams solution extends ConceptDraw DIAGRAM diagramming software with samples, templates and libraries of specially developed smart vector design elements of timeline bars, time intervals, milestones, events, today marker, legend, and many other elements with custom properties, helpful for professional drawing clear and intuitive Timeline Diagrams. Use it to design simple Timeline Diagrams and designate only the main project stages, or highly detailed Timeline Diagrams depicting all project tasks, subtasks, milestones, deadlines, responsible persons and other description information, ideal for applying in presentations, reports, education materials, and other documentation.
How to Make a Timeline

Project Timeline

Examples of Flowcharts, Org Charts and More


"Value Stream Mapping (VSM):
– Special type of flow chart that uses symbols known as "the language of Lean" to depict and improve the flow of inventory information. ...
Value Stream Mapping ...
Provide optimum value to the customer through a complete value creation process with minimum waste in:
– Design (concept to customer);
– Design (concept to customer);
– Build (order to delivery);
– Sustain (in-use through life cycle to service)." [courses.washington.edu/ ie337/ Value_ Stream_ Mapping.pdf]
This sample Value Stream Map shows how customer value is created in the steps of manufacturing, production control, and shipping processes.
This VSM example was created using the ConceptDraw PRO diagramming and vector drawing software extended with the Value Stream Mapping solution from the Quality area of ConceptDraw Solution Park.
Value stream mapping

 Business Processes
Business Process solution extends ConceptDraw DIAGRAM software with business process diagrams as cross-functional flowcharts, workflows, process charts, IDEF0, timelines, calendars, Gantt charts, business process modeling, audit and opportunity flowcharts.
The vector stencils library "Timelines and milestones" contains 24 shapes of time scales with start and finish dates, time interval bars with progress indication and brackets, milestone, event and today markers for drawing the timeline diagrams using the ConceptDraw PRO diagramming and vector drawing software.
"A timeline is a way of displaying a list of events in chronological order, sometimes described as a project artifact. It is typically a graphic design showing a long bar labelled with dates alongside itself and (usually) events labelled on points where they would have happened. ...
Another type of timeline is used for project management. In these cases, timelines are used to help team members to know what milestones need to be achieved and under what time schedule. For example, in the case of establishing a project timeline in the implementation phase of the life cycle of a computer system." [Timeline. Wikipedia]
The example "Design elements - Timelines solution" is included in the Timeline Diagrams solution from the Management area of ConceptDraw Solution Park.
Timeline and milestone symbols

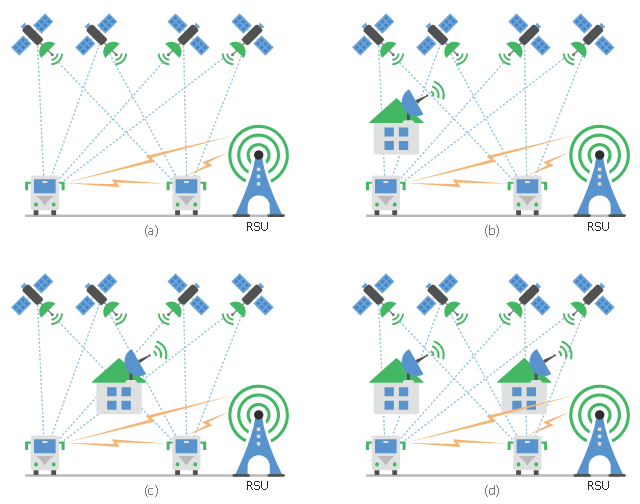
This diagram sample shows the different situations that cooperative positioning may be helpful for vehicular networks. It was designed on the base of Wikimedia Commons file: CPsituations.jpg.
[commons.wikimedia.org/ wiki/ File:CPsituations.jpg]
"Vehicular Ad Hoc Networks (VANETs) are created by applying the principles of mobile ad hoc networks (MANETs) - the spontaneous creation of a wireless network for data exchange - to the domain of vehicles. They are a key component of intelligent transportation systems (ITS).
While, in the early 2000s, VANETs were seen as a mere one-to-one application of MANET principles, they have since then developed into a field of research in their own right. By 2015, the term VANET became mostly synonymous with the more generic term inter-vehicle communication (IVC), although the focus remains on the aspect of spontaneous networking, much less on the use of infrastructure like Road Side Units (RSUs) or cellular networks." [Vehicular ad hoc network. Wikipedia]
The vehicular network diagram example "CP situations" was created using the ConceptDraw PRO diagramming and vector drawing software extended with the Computers and Communications solution from the Illustration area of ConceptDraw Solution Park.
Telecommunication diagram
 Marketing
This solution extends ConceptDraw DIAGRAM and ConceptDraw MINDMAP with Marketing Diagrams and Mind Maps (brainstorming, preparing and holding meetings and presentations, sales calls).
 ConceptDraw Solution Park
ConceptDraw Solution Park collects graphic extensions, examples and learning materials
Business diagrams & Org Charts with ConceptDraw DIAGRAM


 Area Charts
Area Charts are used to display the cumulative totals over time using numbers or percentages; or to show trends over time among related attributes. The Area Chart is effective when comparing two or more quantities. Each series of data is typically represented with a different color, the use of color transparency in an object’s transparency shows overlapped areas and smaller areas hidden behind larger areas.
Timeline charts presents events and time periods on a chronological scale. They are used in project management to visualize project milestones and upper level phases, and show project progress.
"Within the framework of project management, a milestone is an event that receives special attention. It is often put at the end of a stage to mark the completion of a work package or phase. Milestones can be put before the end of a phase so that corrective actions can be taken, if problems arise, and the deliverable can be completed on time.
In addition to signaling the completion of a key deliverable, a milestone may also signify an important decision or the derivation of a critical piece of information, which outlines or affects the future of a project. In this sense, a milestone not only signifies distance traveled (key stages in a project) but also indicates direction of travel since key decisions made at milestones may alter the route through the project plan." [Milestone (project management). Wikipedia]
This timeline diagram example was created using the ConceptDraw PRO diagramming and vector drawing software extended with the Timeline Diagrams solution from the Management area of ConceptDraw Solution Park.
Timeline

 Management
This solution extends ConceptDraw DIAGRAM and ConceptDraw MINDMAP with Management Diagrams and Mind Maps (decision making, scheduling, thinking ideas, problem solving, business planning, company organizing, SWOT analysis, preparing and holding meetings
 Enterprise Architecture Diagrams
Enterprise Architecture Diagrams solution extends ConceptDraw DIAGRAM software with templates, samples and library of vector stencils for drawing the diagrams of enterprise architecture models.
 Event-driven Process Chain Diagrams
Event-Driven Process Chain Diagrams solution extends ConceptDraw DIAGRAM functionality with event driven process chain templates, samples of EPC engineering and modeling the business processes, and a vector shape library for drawing the EPC diagrams and EPC flowcharts of any complexity. It is one of EPC IT solutions that assist the marketing experts, business specialists, engineers, educators and researchers in resources planning and improving the business processes using the EPC flowchart or EPC diagram. Use the EPC solutions tools to construct the chain of events and functions, to illustrate the structure of a business process control flow, to describe people and tasks for execution the business processes, to identify the inefficient businesses processes and measures required to make them efficient.
HelpDesk
How to Shift Dates in ConceptDraw PROJECT

- Timeline template | Examples of Flowcharts, Org Charts and More ...
- Project timeline diagram - New business project plan ...
- Project timeline diagram - New business project plan | Timeline ...
- Timeline Diagrams | Line Chart Examples | Line Graph Charting ...
- Timeline Diagrams | Line Chart Examples | Value stream map ...
- Examples of Flowcharts, Org Charts and More | Project timeline ...
- Timeline Diagrams
- Value stream map example | Timeline Diagrams | Communication ...
- Timeline Diagrams | Timeline diagram template | Project timeline ...
- Management | Timeline Diagrams | Value stream map example ...
- Timeline Diagrams | Value stream map example | Value stream ...
- Value stream map example | Marketing | Management | Timeline ...
- Timeline Diagrams | Is ConceptDraw an Alternative to Visio? | Seven ...
- Timeline Diagrams | ConceptDraw PRO The best Business Drawing ...
- Project timeline - Request for proposal plan | PERT chart - Request ...
- Examples of Flowcharts, Org Charts and More | Project timeline ...
- Business Processes | Timeline Diagrams | Business diagrams & Org ...
- Gantt chart examples | Timeline Diagrams | CORRECTIVE ACTIONS ...
- Business Productivity Area | Buisness Planning Timeline Examples
- Project timeline diagram