Project Timeline
Project timeline is a type of chart which allows visually represent the chronology of works for the project, placing the key points of the project (milestones) on a timescale. You need to make professional looking project timeline? Create it with ConceptDraw DIAGRAM ! ConceptDraw DIAGRAM extended with Timeline Diagrams Solution from the Management Area is the best timeline diagrams softwareGantt chart examples
All Gantt charts were made using ConceptDraw PROJECT. ConceptDraw PROJECT works both on Windows and Mac OS X. It allows to schedule a voluntary number of projects in a single Workspace document and lets easily share tasks and resources among them. ConceptDraw PROJECT shares files among Windows and Mac OS X.
 Timeline Diagrams
Timeline Diagrams solution extends ConceptDraw DIAGRAM diagramming software with samples, templates and libraries of specially developed smart vector design elements of timeline bars, time intervals, milestones, events, today marker, legend, and many other elements with custom properties, helpful for professional drawing clear and intuitive Timeline Diagrams. Use it to design simple Timeline Diagrams and designate only the main project stages, or highly detailed Timeline Diagrams depicting all project tasks, subtasks, milestones, deadlines, responsible persons and other description information, ideal for applying in presentations, reports, education materials, and other documentation.
Gantt Chart Software
ConceptDraw PROJECT is a powerful Gantt Chart Software. The Gantt Charts are useful for displaying a large amount of detailed information, project tasks and timelines in a visually pleasing, easy-to-understand format. ConceptDraw PROJECT provides wide capabilities of importing and exporting in various formats: Microsoft Project, ConceptDraw MINDMAP , Mindjet MindManager, PDF file.Timeline Examples
ConceptDraw DIAGRAM diagramming and vector drawing software offers the Timeline Diagrams solution from the Management area which is rich for the timeline examples, samples, templates and ready-to-use vector shapes.Gantt chart examples
All Gantt charts were made using ConceptDraw PROJECT. ConceptDraw PROJECT works both on Windows and Mac OS X. It allows to schedule a voluntary number of projects in a single Workspace document and lets easily share tasks and resources among them. ConceptDraw PROJECT shares files among Windows and Mac OS X.Daily Schedule Chart
ConceptDraw DIAGRAM diagramming and vector drawing software extended with Target and Circular Diagrams solution from the Marketing area of ConceptDraw Solution Park is a powerful tool for Daily Schedule Chart design.How To Show Project Progress Peport on Web
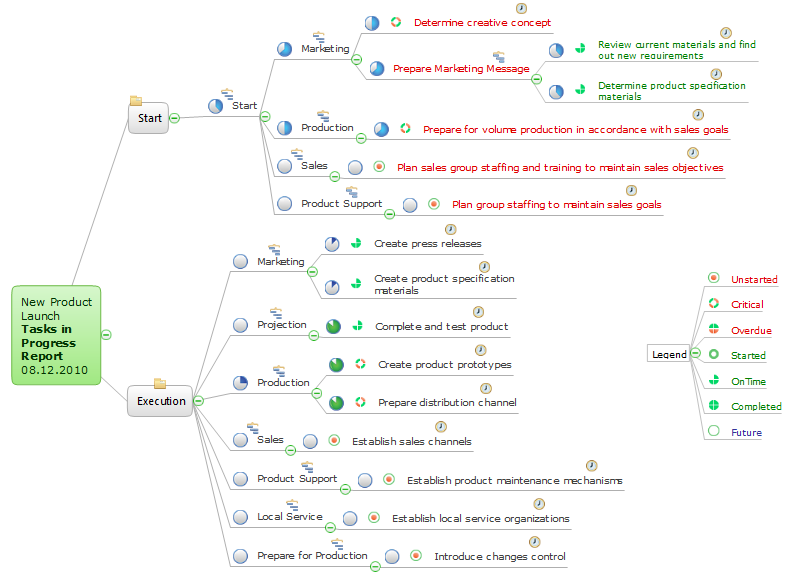
Project progress on web: delivering project status to remote teams and stakeholders via Skype.
Pyramid Diagram
The Project Management Triangle Diagram depicts three main constraints of any project: scope, time and cost. Projects have to comply with the specified scope, projects should be finished in time and projects need to consume the budget. Each of the constraints represents one side of the triangle, and any change in budget or timing or scope affects the entire diagram. This diagram was made using ConceptDraw Office suite including best marketing project management software extended with collection of tools for creative project management software and project management reporting software symbols.Program Evaluation and Review Technique (PERT) with ConceptDraw DIAGRAM
Program Evaluation and Review Technique (abbr. PERT) is a method developed by Ministry of Defense of the USA in 1958 for the project of creation the missile system Polaris. PERT diagram is one of the tools for project management that lets greatly simplify the planning and scheduling of large and complex projects. PERT diagram provides evaluation of project run-time and labor forces, it helps to analyze the time necessary for execution each of project tasks and the whole project, and to calculate the project critical path. PERT chart depicts the set of tasks connected each other in order of their execution and is constructed according to one of definite rules - AOA (activity on arrow) or AON (activity on node). It doesn't give you ready concrete decisions, but helps to find them. Design easy the PERT diagrams in ConceptDraw DIAGRAM software enhanced with Seven Management and Planning Tools solution from Management area of ConceptDraw Solution Park. You have a possibility to build the PERT chart of any type, but AON variant is easier for building and perception.Activity Network (PERT) Chart
Activity Network and Project Evaluation and Review Technique, or PERT, charts are a way of documenting and analyzing the tasks in a project. This diagram is constructed as part of the process in creating a schedule of corrective actions. The Activity Network Chart (PERT) shows the logical connections and consequence of tasks to be performed. It displays the time period for problem solving and the implementation of all activities through the critical path.PERT Chart
The program (or project) evaluation and review technique, commonly abbreviated PERT, is a statistical tool, used in project management, which was designed to analyze and represent the tasks involved in completing a given project. ConceptDraw DIAGRAM diagramming and vector drawing software extended with Seven Management and Planning Tools Solution from the Management Area offers the extensive drawing tools for effective drawing the PERT Chart of any complexity.ConceptDraw PROJECT Software Overview
ConceptDraw PROJECT is an effective tool for new and experienced users with a fine balance of usability and powerful functionality.CORRECTIVE ACTIONS PLANNING. PERT Chart
The PERT Chart is constructed as part of the process in creating a schedule of corrective actions. The PERT Chart shows the logical connections and consequence of tasks to be performed. It displays the time period for problem solving and the implementation of all activities through the critical path. ConceptDraw Office suite is a software for corrective actions planning.
Project Management
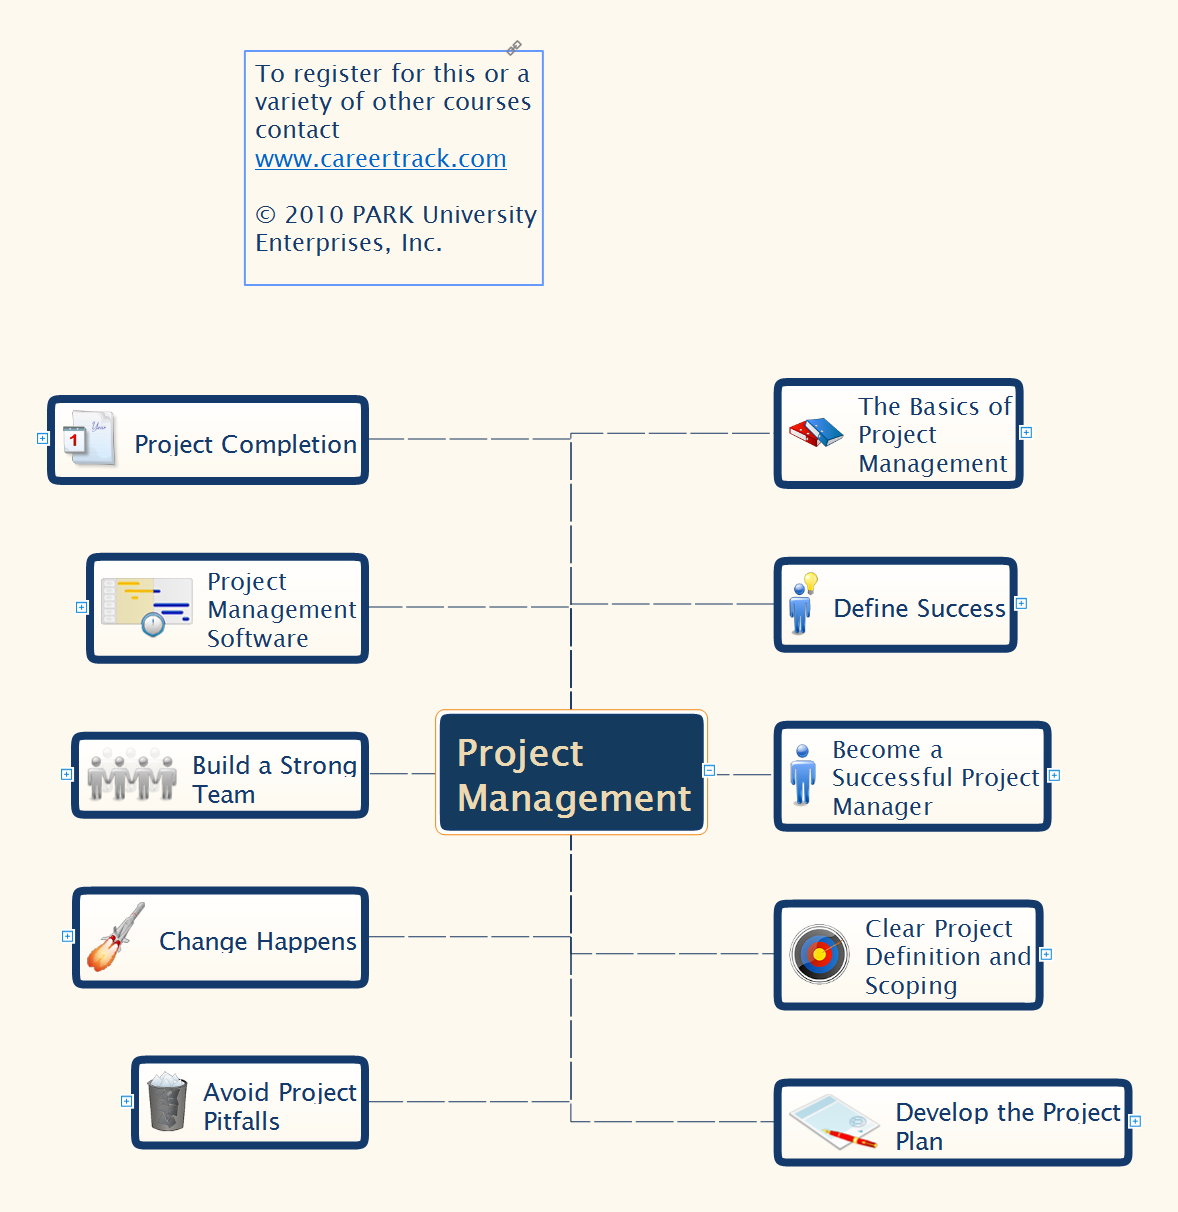
Mind Maps is a visual tool that helps to structure, understand and analyze the information, to find new ideas and solutions to problems. They find their application in many areas of life due to the fact that are convenient graphical way of presenting information. The project management is one of the most popular applications of Mind Maps, which give you the opportunity to make your project plan, to navigate easier in the project and manage it visually, to systematize knowledge, to get a clear picture of what is happening in the project, to save time and quickly find the right solutions and possible defects. Mind Maps ideally suit as a way to make notes during the meetings, presentations, conferences, to record ideas generated during a brainstorming. ConceptDraw MINDMAP software is effective for using in project management. It offers the tools for brainstorming and Mind Maps construction, helps project managers to visually represent the whole project, its implementation phases, to track the current state and switch between the different levels of detailing, showing or hiding some branches. ConcepDraw MINDMAP lets the possibility to make the report or presentation from your Mind Map and provides the compatibility with ConceptDraw Project and MS Project."Project planning is part of project management, which relates to the use of schedules such as Gantt charts to plan and subsequently report progress within the project environment.
Initially, the project scope is defined and the appropriate methods for completing the project are determined. Following this step, the durations for the various tasks necessary to complete the work are listed and grouped into a work breakdown structure. Project planning is often used to organize different areas of a project, including project plans, work loads and the management of teams and individuals. The logical dependencies between tasks are defined using an activity network diagram that enables identification of the critical path. Float or slack time in the schedule can be calculated using project management software. Then the necessary resources can be estimated and costs for each activity can be allocated to each resource, giving the total project cost. At this stage, the project schedule may be optimized to achieve the appropriate balance between resource usage and project duration to comply with the project objectives. Once established and agreed, the project schedule becomes what is known as the baseline schedule. Progress will be measured against the baseline schedule throughout the life of the project. Analyzing progress compared to the baseline schedule is known as earned value management.
The inputs of the project planning phase include the project charter and the concept proposal. The outputs of the project planning phase include the project requirements, the project schedule, and the project management plan." [Project planning. Wikipedia]
The flow chart example "Project planning process" was created using the ConceptDraw PRO diagramming and vector drawing software extended with the Flowcharts solution from the area "What is a Diagram" of ConceptDraw Solution Park.
 Seven Management and Planning Tools
Seven Management and Planning Tools solution extends ConceptDraw DIAGRAM and ConceptDraw MINDMAP with features, templates, samples and libraries of vector stencils for drawing management mind maps and diagrams.
How To Plan and Implement Projects Faster
ConceptDraw Office is the most effective tool for planning, tracking, and reporting all types of projects with strong management capabilities, user friendly functionality, and superior ease of use. In this tutorial video we will assist you in planning and managing a project using ConceptDraw Office.How to Create Gantt Chart
To begin managing a new project, you will need to define the individual Tasks that must be completed to deliver it. The default view for a new project in ConceptDraw PROJECT is the Gantt Chart.Daily Planning
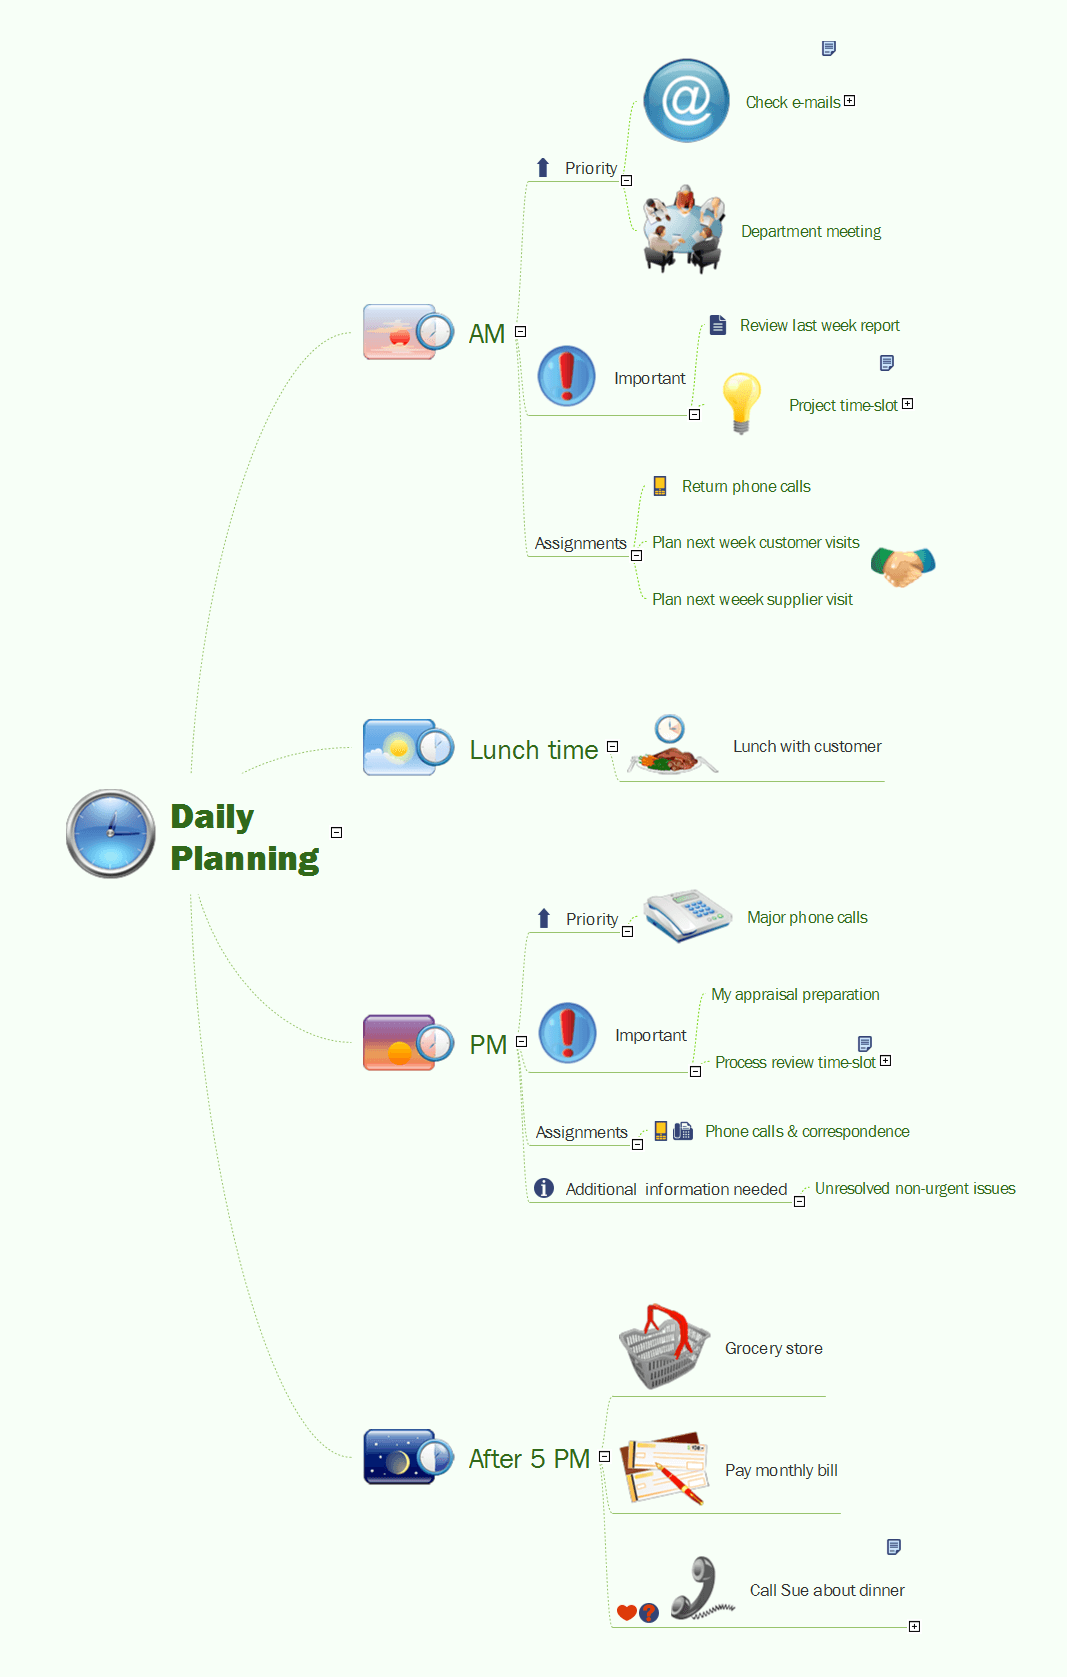
The time is priceless, so it is useful to rationally and productively arrange our day. The managing and organizing of time helps in increasing efficiency and in rising chances on the success. One of the best tools for personal time planning, self-organization and self-improvement is a Mind Map. It can become a great helper at your life, from the preparation your daily schedule to definition your life purpose. The Mind Map is a useful way to make convenient plan of working on the day, week, month, year. A well thought-out Mind Map is a guarantee of holding productive day and a great help at certain moments in order to not miss important affairs and events. Besides, a Mind Map is a very good way to keep your focus through the day and improve your quality of life. Organize and schedule easy each your day using the mind mapping technique and ConceptDraw MIDMAP software powerful in questions of mind mapping and organizing a daily schedule. It lets visually represent all important tasks and affairs on a single Daily Planning Mind Map, and lets highlight the most important and urgent tasks using the special symbols and clipart.- Project Timeline | Timeline Examples | How to Make a Timeline ...
- Gantt charts for planning and scheduling projects | Project ...
- Sample Project Flowchart. Flowchart Examples | Project ...
- Project Management Sample Schedule
- Timeline Examples | Project Timeline | How to Make a Timeline ...
- Timeline Examples | Project Timeline | How to Create a Timeline ...
- Construction Project Chart Examples | Restaurant Floor Plans ...
- Sample Project Timeline
- Gantt chart examples | Online Marketing Objectives | Gant Chart in ...
- How to Create a Timeline Diagram | Project Timeline | How to Make ...
- Gantt chart examples | Gant Chart in Project Management | Gantt ...
- Project Time Management Plan Sample
- Project Timeline | How to Create a Timeline Diagram | How to Make ...
- Software Project Management Sample Project Gantt Chart
- Timeline Examples | Project Timeline | Timeline Diagrams | Visio ...
- Construction Progress Chart Sample
- Ms Project Sample Construction Schedule Pdf
- Project Timeline | How to Make a Timeline | Timeline Diagrams ...
- Construction Project Chart Examples | Gant Chart in Project ...
- Project — Working With Costs | How to Create Multiple Projects ...


