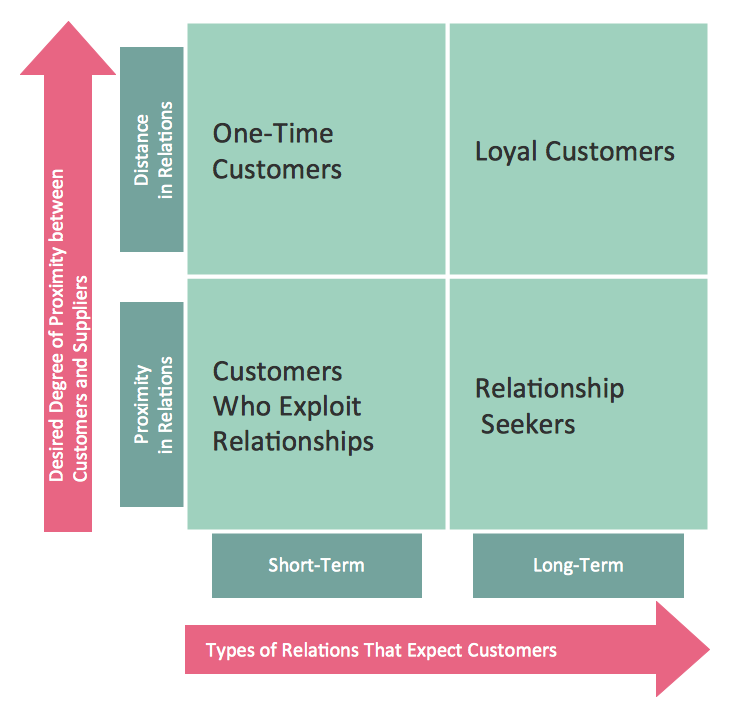
Positioning Map
ConceptDraw DIAGRAM is a powerful diagramming and vector drawing software. Extended with Matrices Solution from the Marketing Area of ConceptDraw Solution Park it became the best software for quick and easy designing various types of Matrix Diagrams, including Positioning Map.Business Tools Perceptual Mapping
This sample shows the Perceptual map. It was created in ConceptDraw DIAGRAM diagramming and vector drawing software using the Matrices Solution from the Marketing area of ConceptDraw Solution Park.Perception Mapping helps organizations measure and transform all aspects of their business, people and culture. Perception Mapping allows to represent the complex relationships graphically, helps identify potential problems of the organization and make the best decisions.
Matrices
This solution extends ConceptDraw DIAGRAM software with samples, templates and library of design elements for drawing the business matrix diagrams.
How to Make SWOT Analysis in a Word Document
A SWOT Analysis is a popular strategic planning tool used to evaluate the Strengths, Weaknesses, Opportunities, and Threats involved in any businesses. You can export your SWOT mind map into a MS Word document, which makes using SWOT mind map easier if you need to collaborate it with other people.ConceptDraw products across any platform, meaning you never have to worry about compatibility again. ConceptDraw MINDMAP allows you to make SWOT analysis on PC or macOS operating systems.
SWOT and TOWS Matrix Diagrams
SWOT and TOWS Matrix Diagrams solution extends ConceptDraw DIAGRAM and ConceptDraw MINDMAP software with features, templates, samples and libraries of vector stencils for drawing SWOT and TOWS analysis matrices and mind maps.
Pyramid Diagram and Pyramid Chart
Pyramid Diagram is very useful to illustrate the foundation-based relationships. ConceptDraw DIAGRAM, a business charting software, includes some build-in symbols for designer to draw all kind of the pyramid diagrams.Deployment Chart Software
ConceptDraw DIAGRAM extended with Matrices solution from the Marketing area of ConceptDraw Solution Park is the best Deployment Chart Software.The Matrices solution offers you the useful tools for creating Deployment Charts in just minutes.
The Deployment Charts designed with ConceptDraw DIAGRAM are vector graphic documents and are available for reviewing, modifying, converting to a variety of formats (image, HTML, PDF file, MS PowerPoint Presentation, Adobe Flash or MS Visio XML), printing and send via e-mail in one moment.
Growth-Share Matrix Software
Growth-Share Matrix Software - ConceptDraw DIAGRAM is a powerful diagramming and vector drawing software for creating professional looking Growth–Share Matrices. For simple and quick creating the Growth–Share Matrix ConceptDraw DIAGRAM offers the Matrices Solution from the Marketing Area of ConceptDraw Solution Park.The Matrices Solution also provides a wide variety of templates and samples that will help you to create the Matrix diagrams of any difficulty.
Telecommunication Network Diagrams
Telecommunication Network Diagrams solution extends ConceptDraw DIAGRAM software with samples, templates, and great collection of vector stencils to help the specialists in a field of networks and telecommunications, as well as other users to create Computer systems networking and Telecommunication network diagrams for various fields, to organize the work of call centers, to design the GPRS networks and GPS navigational systems, mobile, satellite and hybrid communication networks, to construct the mobile TV networks and wireless broadband networks.
Matrices
ConceptDraw DIAGRAM extended with Matrices Solution from the Marketing Area of ConceptDraw Solution Park is a powerful software for drawing various types of Marketing Matrices: Ansoff Matrix, BCG Matrix, Deployment Chart, Feature Comparison Chart, Competitive Strategies Matrix, Flow Process Chart, Porter's Value Chain Diagram, Positioning Map, and many others.Porter's Value Chain
The available pre-made examples of the matrices, including the Porter's Value Chain’s one can be found in the mentioned solution. It also allows creating an Ansoff matrix, a BCG matrix, a Competitive strategies matrix, a Four-quadrant matrix, a Chore chart, a Flow process chart, a Quality function deployment matrix, a Positioning map and Porter’s generic strategies matrix being based on the templates given within the Matrices solution.BCG Matrix
The growth–share matrix (BCG Matrix) was created by Bruce D. Henderson for the Boston Consulting Group in 1970 to help corporations to analyze their business units and to help the company allocate resources. How is it easy design the BCG Matrices in ConceptDraw DIAGRAM diagramming and vector drawing software supplied with unique Matrices Solution from the Marketing Area of ConceptDraw Solution Park.Pyramid Charts
ConceptDraw DIAGRAM extended with Pyramid Diagrams Solution from the Marketing Area of ConceptDraw Solution Park is a powerful Pyramid Charts making software.A Pyramid Chart has the form of triangle and hierarchically structures, organizes and help to analyze the information, data or ideas. Triangle is divided on the sections that usually have different widths. The width indicates the level of hierarchy among the topics.
Competitor Analysis
Competitor analysis is a first and obligatory step in elaboration the proper corporate marketing strategy and creating sustainable competitive advantage. Use powerful opportunities of numerous solutions from ConceptDraw Solution Park for designing illustrative diagrams, charts, matrices which are necessary for effective competitor analysis.
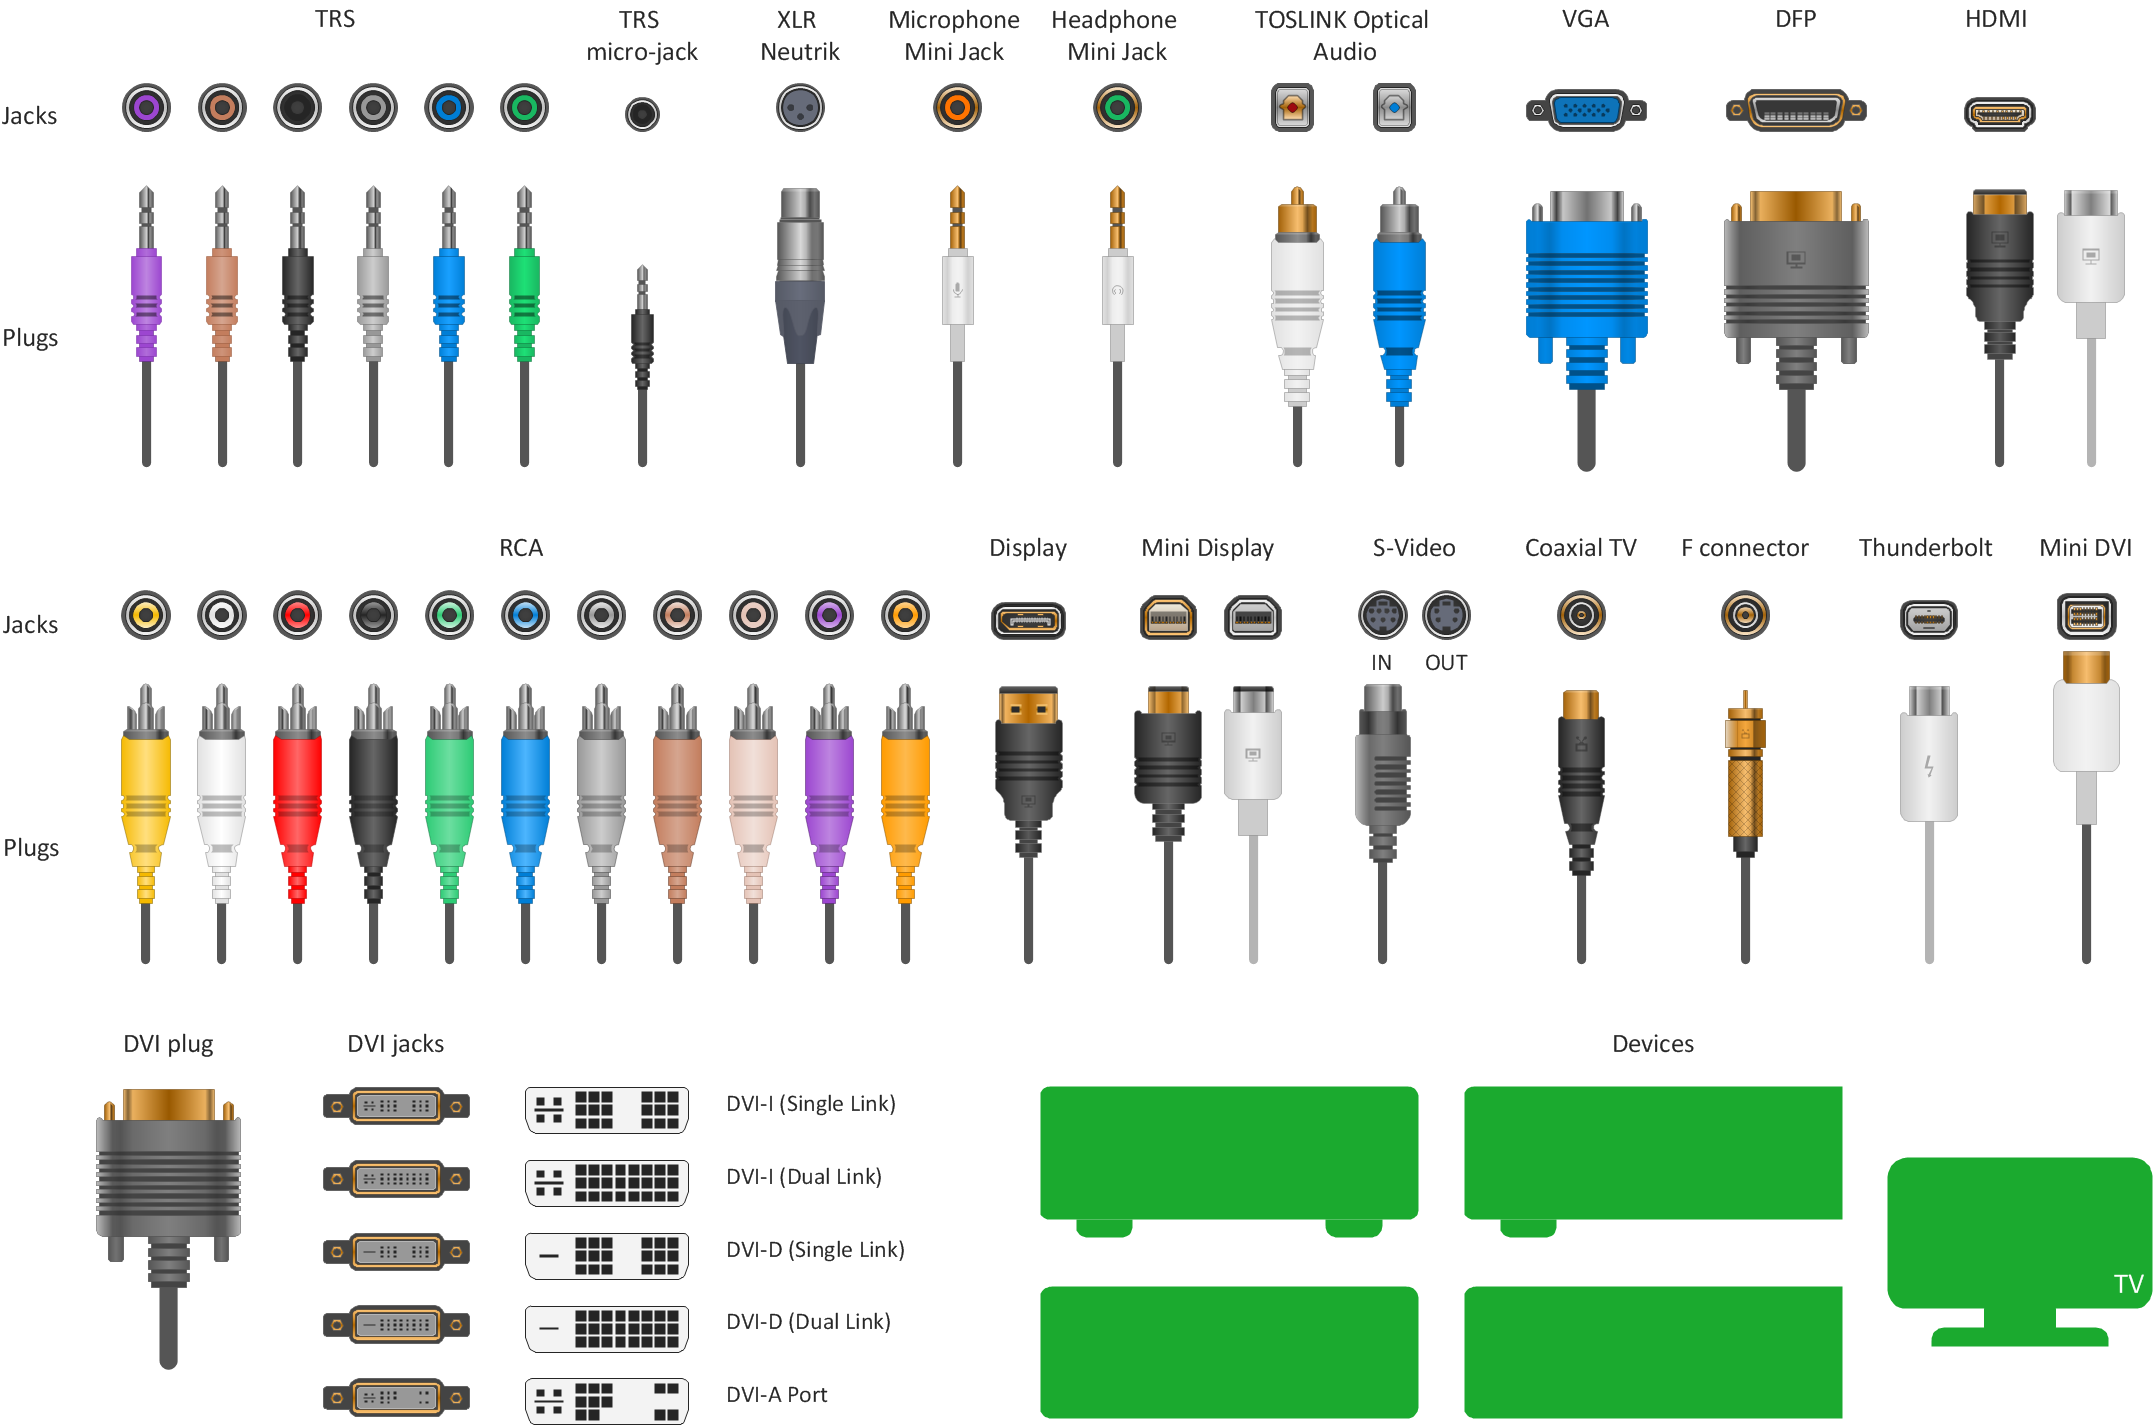
How to Make Audio and Video Connections
Use the ConceptDraw DIAGRAM software that has vector clipart of numerous cable connectors, examples, and templates for drawing different types of audio and video connection diagrams. Paste icon of the receiver or another device to page and layout sockets and plugs. Further connect plugs with each other, and now you have well-designed connection diagram.- Sample Of Positioning Graph
- Positioning map | Positioning Map | Business Tools Perceptual ...
- Positioning map | Positioning Map | SWOT analysis positioning ...
- Brand Positioning Chart Template
- Sample Positioning Chart
- Marketing Product Positioning Example
- Positioning map | Swot Analysis Examples for Mac OSX | Positioning ...
- SWOT Analysis Solution - Strategy Tools | Positioning map | Pyramid ...
- Swot Analysis Examples | SWOT analysis matrix diagram templates ...
- Positioning map | Positioning Map | Swot Analysis Examples for Mac ...
- Marketing | How to Make Soccer Position Diagram Using ...
- Swot Analysis Examples for Mac OSX | Positioning map | Swot ...
- Positioning map | SWOT analysis matrix diagram templates | What is ...
- Telecommunication Network Diagrams | Simple Flow Chart ...
- Positioning map | SWOT Analysis Solution - Strategy Tools ...
- Product Positioning Examples
- Positioning map | Competitor Analysis | Pyramid Chart Examples ...
- Positioning map | Competitor Analysis | Business Tools Perceptual ...
- Positioning Map | Positioning map | SWOT analysis positioning ...
- Marketing | Positioning map | SWOT Analysis Tool for Small ...
- ERD | Entity Relationship Diagrams, ERD Software for Mac and Win
- Flowchart | Basic Flowchart Symbols and Meaning
- Flowchart | Flowchart Design - Symbols, Shapes, Stencils and Icons
- Flowchart | Flow Chart Symbols
- Electrical | Electrical Drawing - Wiring and Circuits Schematics
- Flowchart | Common Flowchart Symbols