Chart Maker for Presentations

Line Chart Template for Word

 Event-driven Process Chain Diagrams
Event-Driven Process Chain Diagrams solution extends ConceptDraw DIAGRAM functionality with event driven process chain templates, samples of EPC engineering and modeling the business processes, and a vector shape library for drawing the EPC diagrams and EPC flowcharts of any complexity. It is one of EPC IT solutions that assist the marketing experts, business specialists, engineers, educators and researchers in resources planning and improving the business processes using the EPC flowchart or EPC diagram. Use the EPC solutions tools to construct the chain of events and functions, to illustrate the structure of a business process control flow, to describe people and tasks for execution the business processes, to identify the inefficient businesses processes and measures required to make them efficient.
Chart Templates

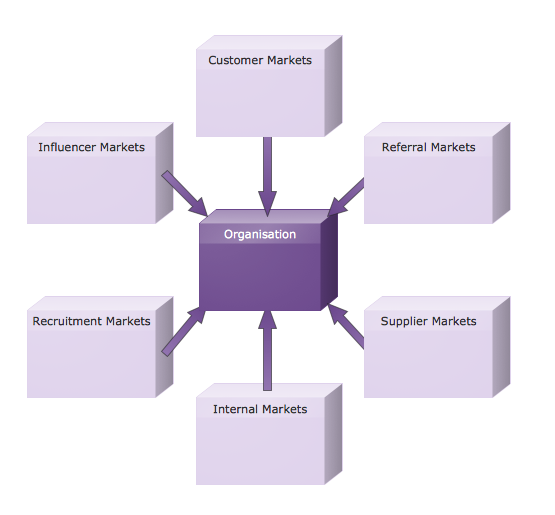
Six Markets Model Chart Template

Customizable Six Markets Model Chart Template
 Cross-Functional Flowcharts
Cross-functional flowcharts are powerful and useful tool for visualizing and analyzing complex business processes which requires involvement of multiple people, teams or even departments. They let clearly represent a sequence of the process steps, the order of operations, relationships between processes and responsible functional units (such as departments or positions).
Bar Chart Template for Word

 Value Stream Mapping
Value stream mapping solution extends ConceptDraw DIAGRAM software with templates, samples and vector stencils for drawing the Value Stream Maps (VSM) in lean manufacturing practice.
Column Chart Template

Pie Chart Word Template. Pie Chart Examples

Pie Chart Examples and Templates

Donut Chart Templates

 Total Quality Management TQM Diagrams
Total Quality Management Diagrams solution extends ConceptDraw DIAGRAM software with samples, templates and vector stencils library for drawing the TQM flowcharts.
TQM Diagram Tool

Pyramid Diagram and Pyramid Chart

 Pie Charts
Pie Charts are extensively used in statistics and business for explaining data and work results, in mass media for comparison (i.e. to visualize the percentage for the parts of one total), and in many other fields. The Pie Charts solution for ConceptDraw DIAGRAM offers powerful drawing tools, varied templates, samples, and a library of vector stencils for simple construction and design of Pie Charts, Donut Chart, and Pie Graph Worksheets.
 Area Charts
Area Charts are used to display the cumulative totals over time using numbers or percentages; or to show trends over time among related attributes. The Area Chart is effective when comparing two or more quantities. Each series of data is typically represented with a different color, the use of color transparency in an object’s transparency shows overlapped areas and smaller areas hidden behind larger areas.
- Data flow model diagram template | Data Flow Diagrams | Data Flow
- Donut Chart Templates
- Flowcharts in Word | Accounting Flowcharts | Cross-Functional ...
- Picture graph template | Picture Graphs | Bar Chart Software |
- Entity-Relationship Diagram (ERD) | How to Create a Powerful ...
- How to Make SWOT Analysis in a Word Document | SWOT analysis ...
- Business Productivity Diagramming | Using Fishbone Diagrams for ...
- How to Create Presentation of Your Project Gantt Chart | PM Teams ...
- Basic Circles Venn Diagram . Venn Diagram Example | Multi Layer ...
- Flowchart Software | Flow chart Example . Warehouse Flowchart ...
- Organizational Structure | How To Do A Mind Map In PowerPoint ...
- Line Chart Templates
- Chart Templates | Donut Chart Templates | Line Chart Templates |
- Area chart template | Cisco Network Templates | Arrow circle chart ...
- SWOT analysis Software & Template for Macintosh and Windows ...
- What is SWOT Analysis in Marketing | SWOT Analysis Software ...
- UML Software | UML for Software Engineers | UML Diagramming ...
- Cross-Functional Flowcharts | Example Process Flow | Flow Chart ...
- 5-Set Venn diagram template
- ConceptDraw PRO - Organizational chart software | Organizational ...