HelpDesk
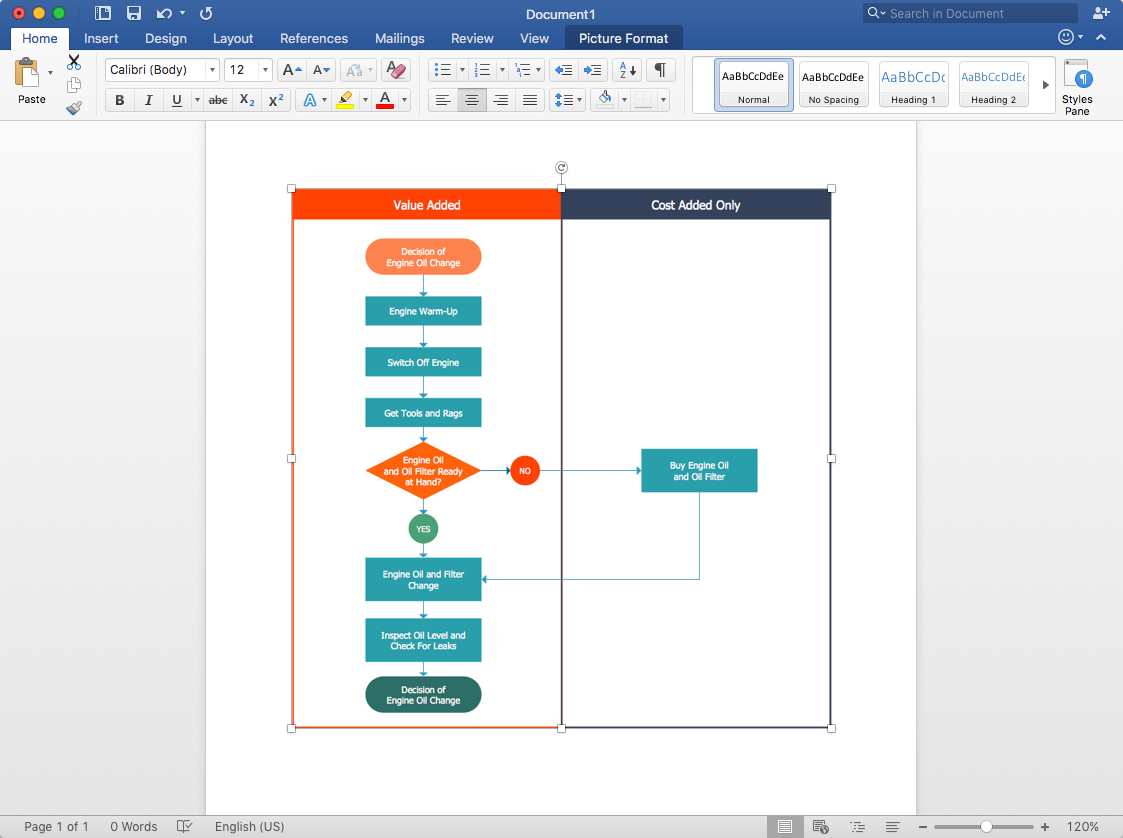
How to Add a Cross-Functional Flowchart to MS Word
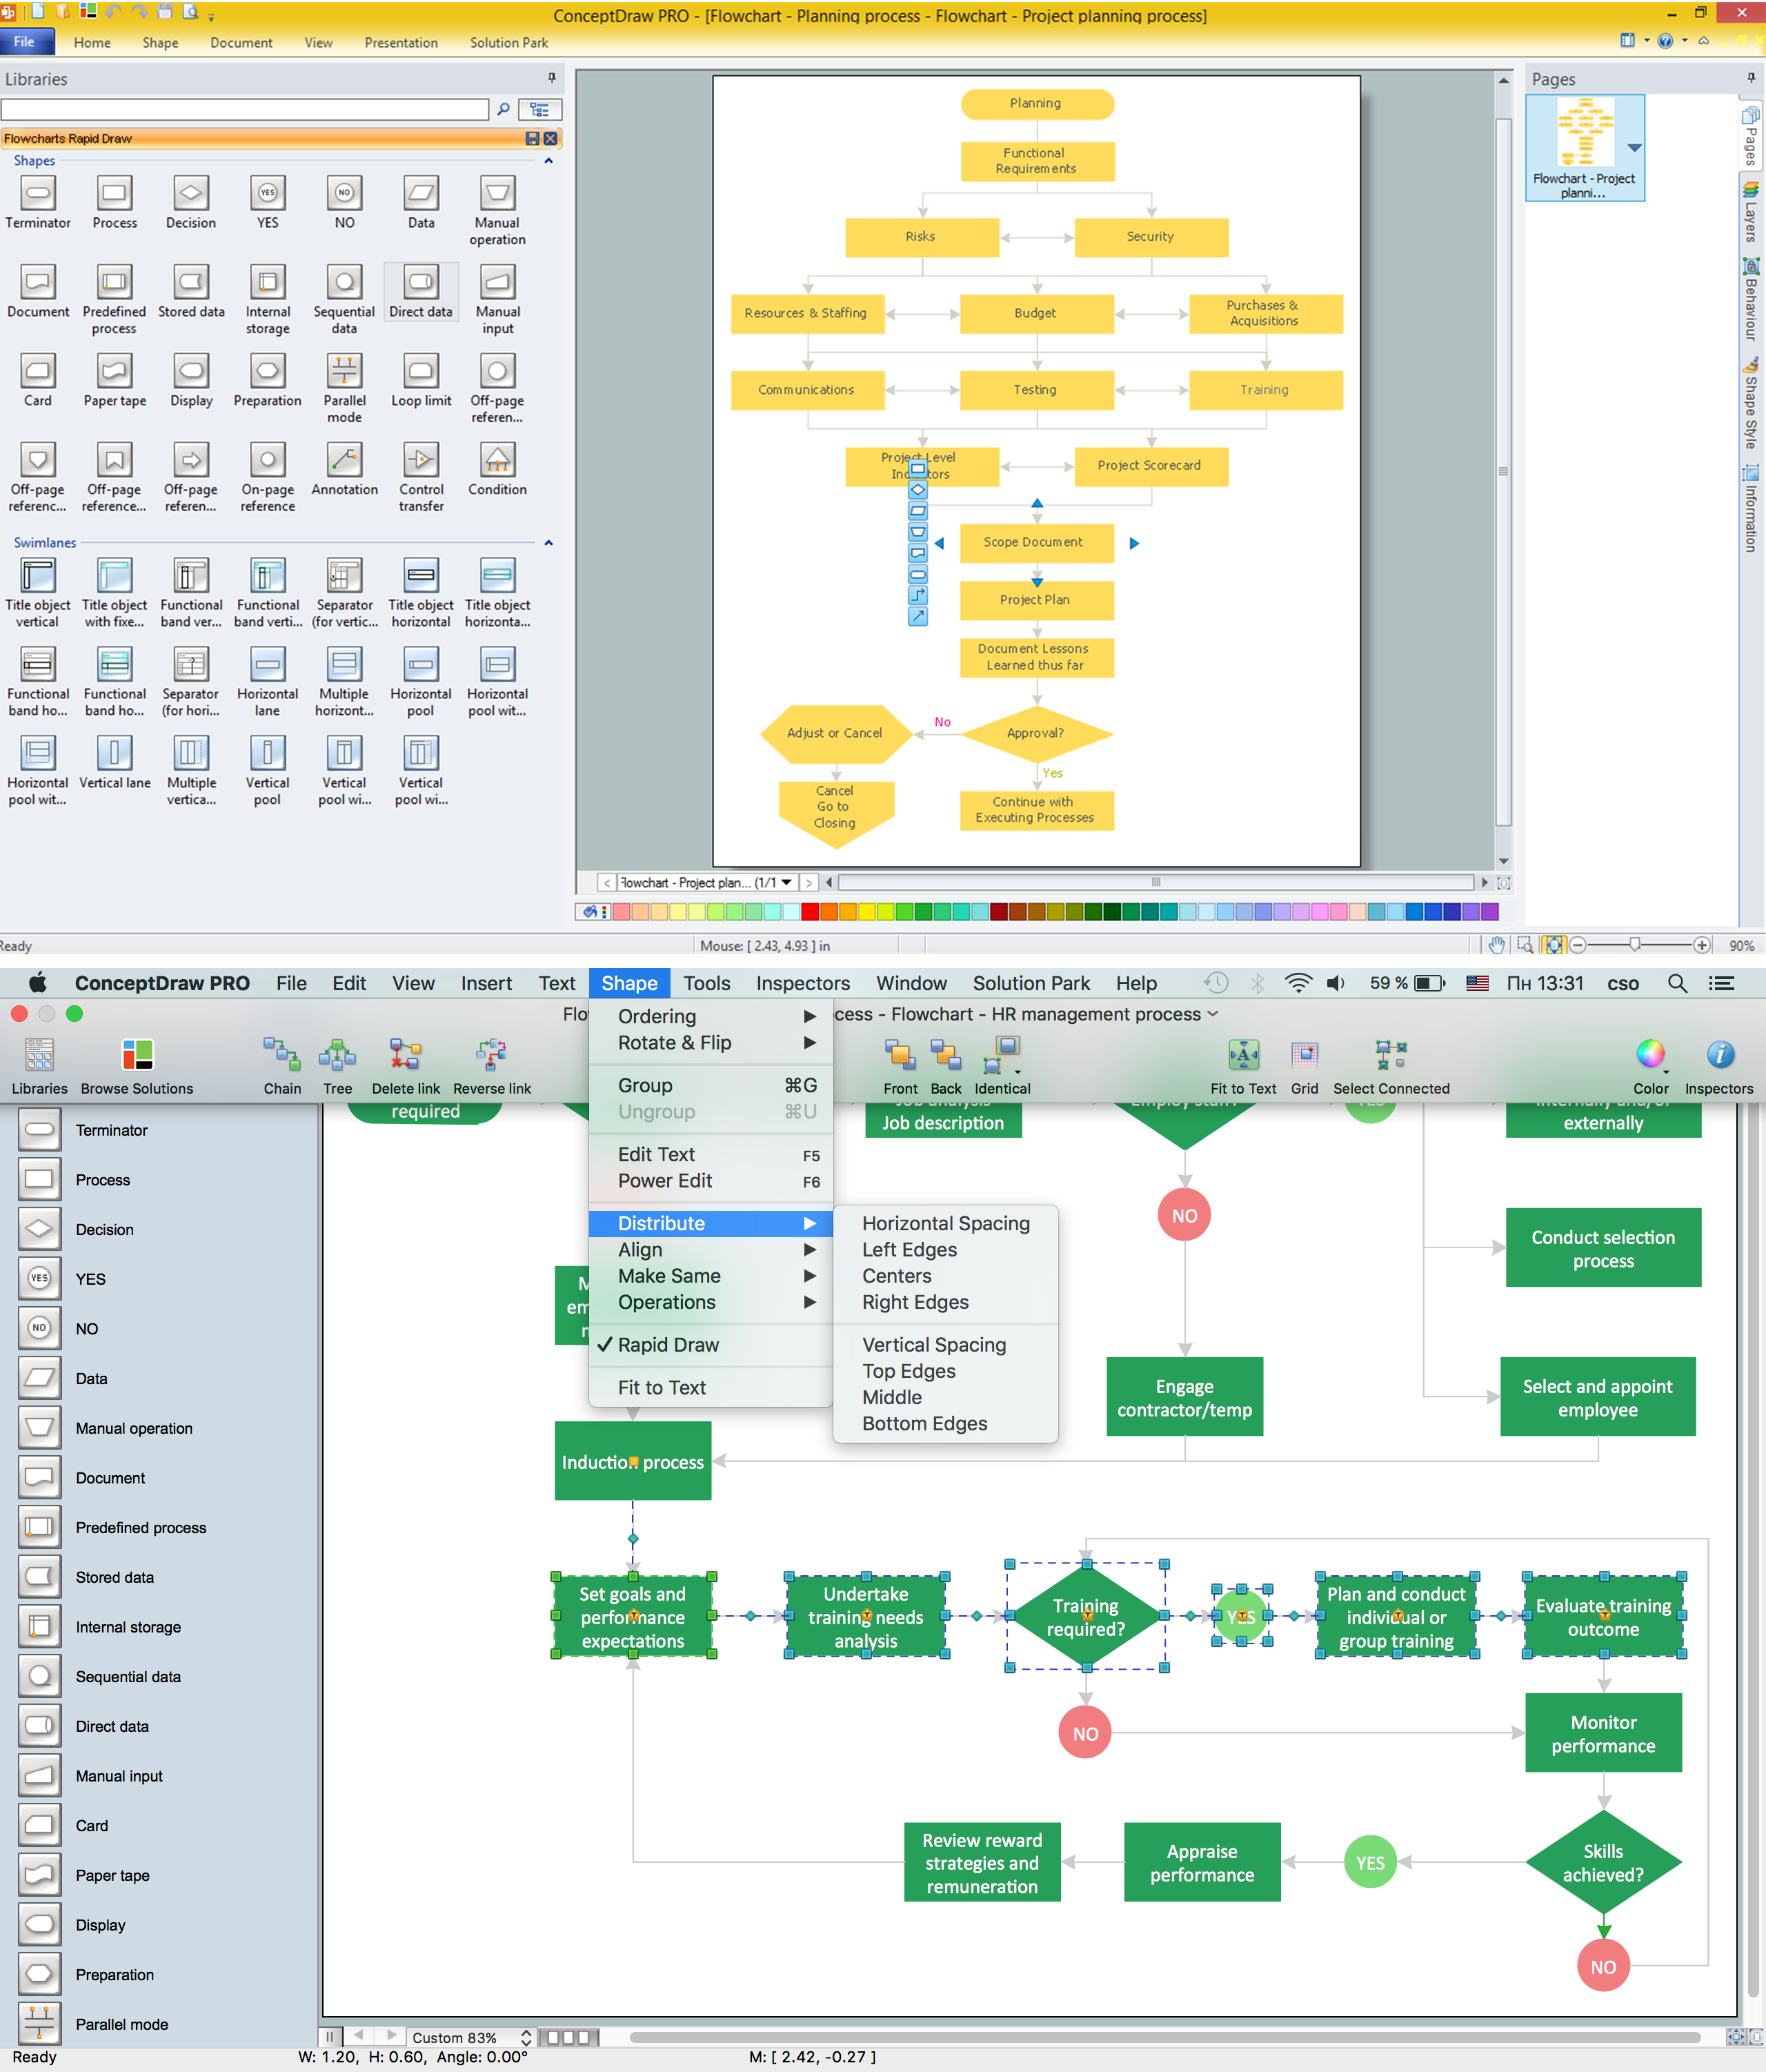
ConceptDraw DIAGRAM allows you to easily create cross-functional flowcharts and then insert them into a MS Word document.HelpDesk
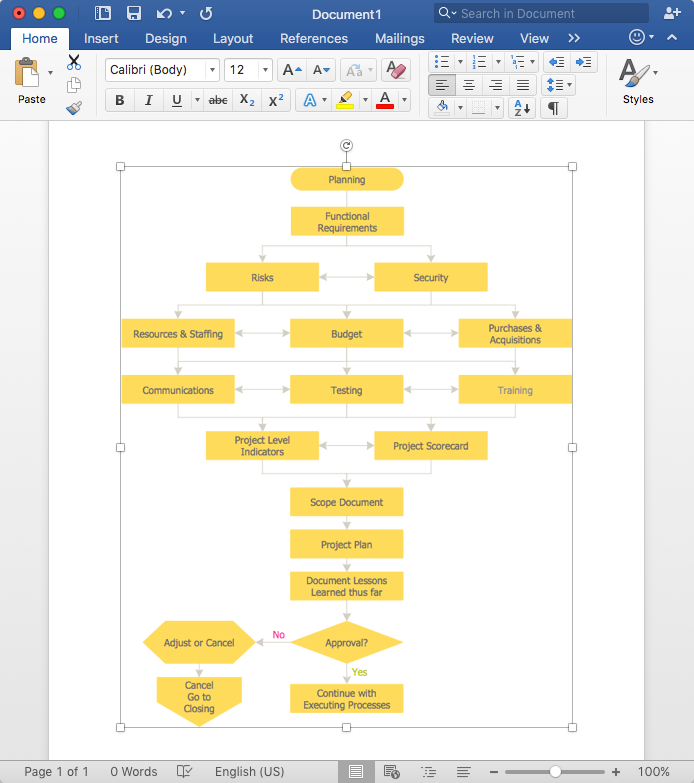
How to Add a Flowchart to MS Word Document
ConceptDraw DIAGRAM allows you to easily create flowcharts and then insert them into a MS Word document.Export from ConceptDraw MINDMAP into MS Word Document
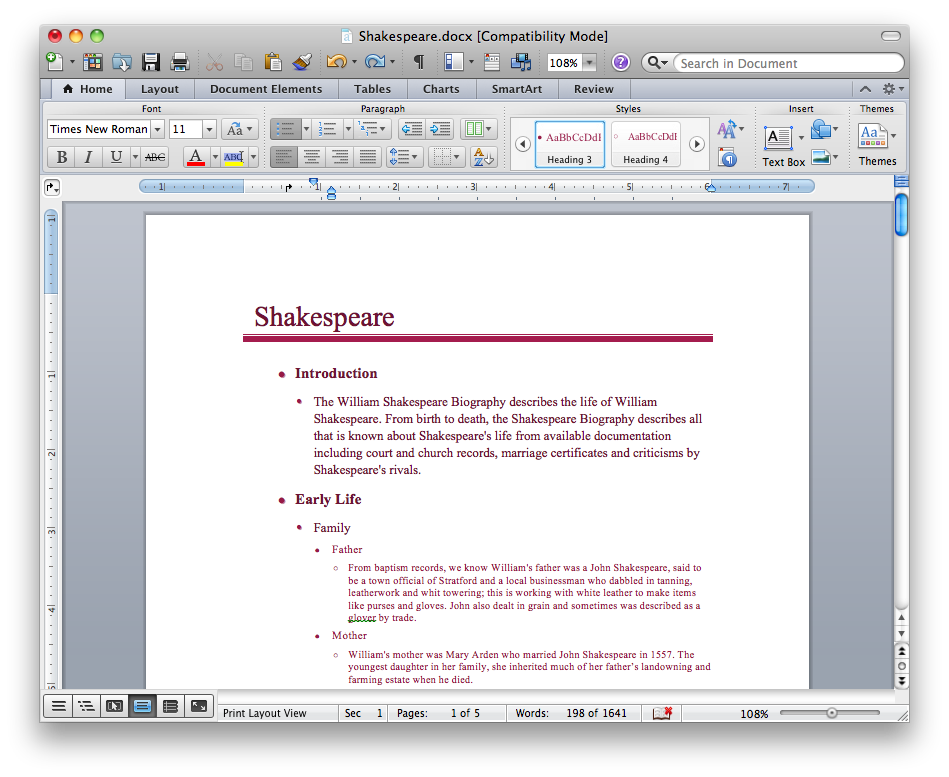
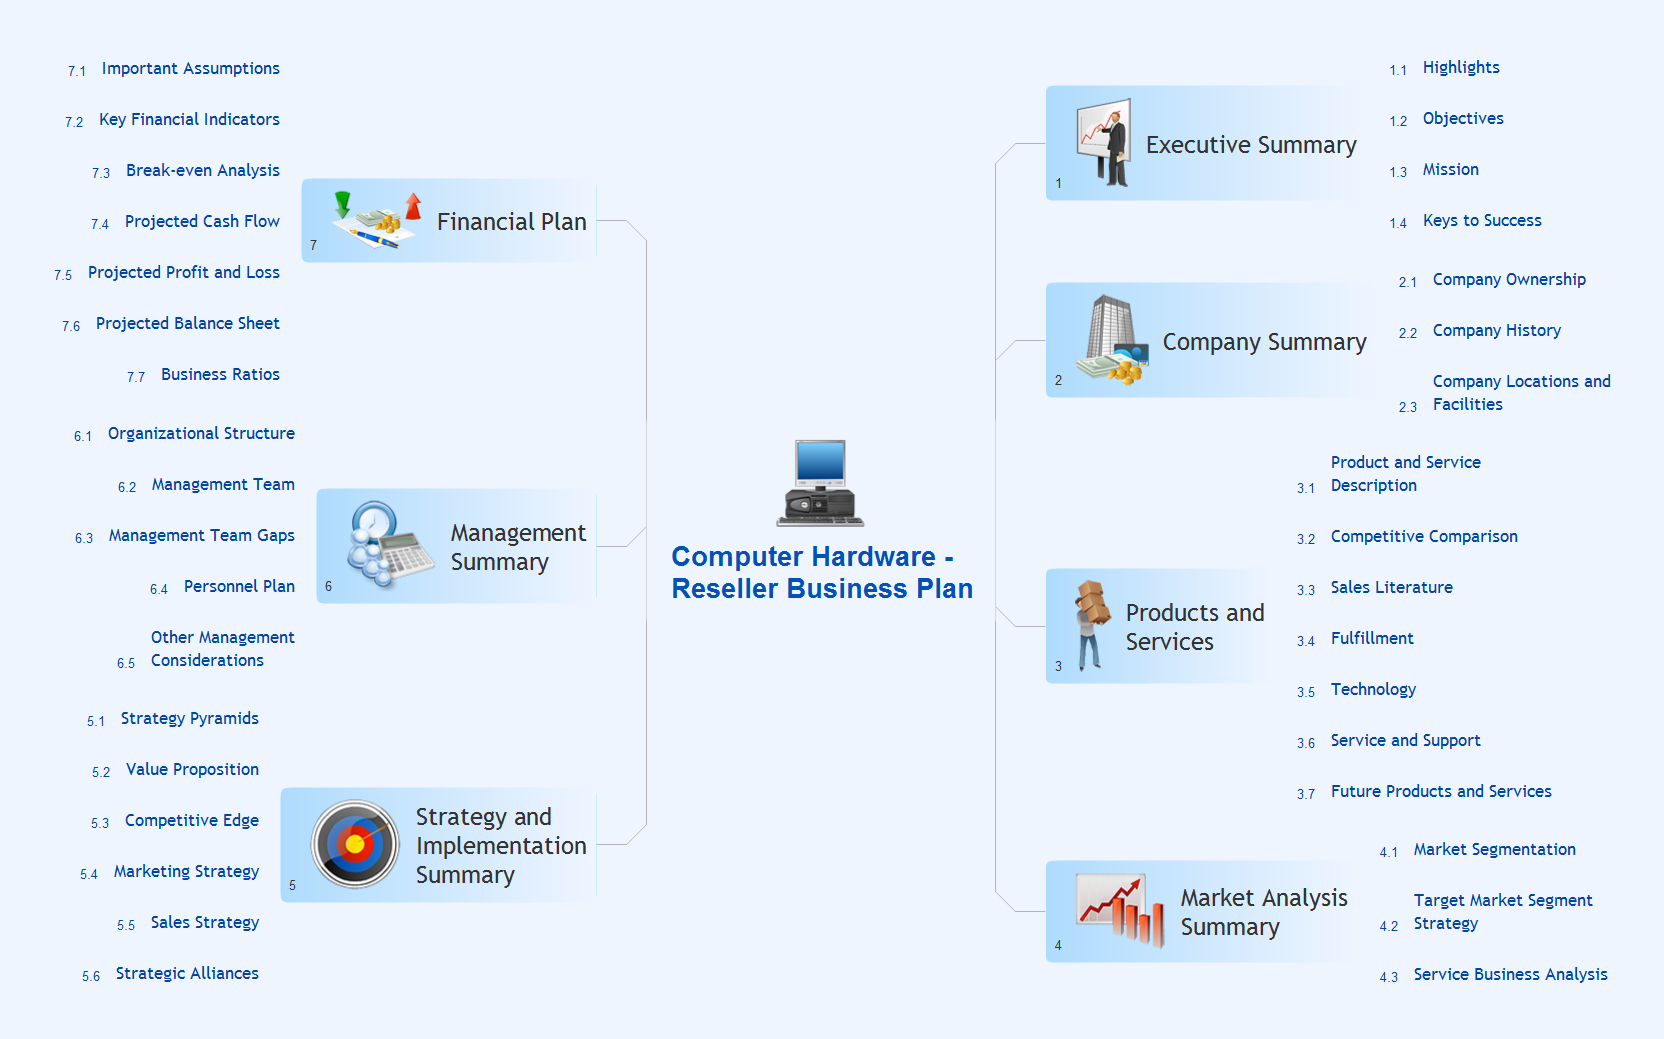
ConceptDraw Word Exchange solution gives you the ability to export mind maps to MS Word. It also allows stylizing the resulting document by using a custom MS Word template.
How to do presentation of Mind Maps via Skype conference call?
ConceptDraw MINDMAP is powerful and multifunctional mind mapping software with wide variety of relevant features, which make it comfortable for brainstorming, generating ideas, creating beautiful and professional-looking Mind Maps. ConceptDraw MINDMAP provides wide importing and exporting capabilities to variety of formats, among them MS PowerPoint, MS Word, MS Excel, FreeMind, XMind, MindJet Mindmanager, HTML, PDF, graphical formats. An innovative Skype conference call feature deserves the special attention of users, it is useful for teams, it lets to hold the presentations of Mind Maps via Skype and to collaborate in active Skype call. But how to do the presentation of Mind Map via Skype conference call by means of ConceptDraw MINDMAP software? Simply make the Skype conference call, share the presentation via Skype for active call participants using the Remote Presentation for Skype solution, keep the presentation file synchronized between all participants of Skype call. ConceptDraw MINDMAP lets also edit a Mind Map and to do slide show again with no interruption a call.Software for flowchart diagrams
Software for flowchart diagrams can help you: represents an algorithm or process, illustrates a solution to a given problem, represented process operations, analyzing a business process, designing a business process, documenting a business process, optimizing a business process. The Flowcharts Solution from the "Diagrams" area of ConceptDraw Solution Park contains a wide set of predesigned templates, samples and 3 libraries.Create Captivating Presentations Easily
When you prepare professional-looking presentation, you need to use ConceptDraw MINDMAP software for the amazing result.Program for Making Presentations
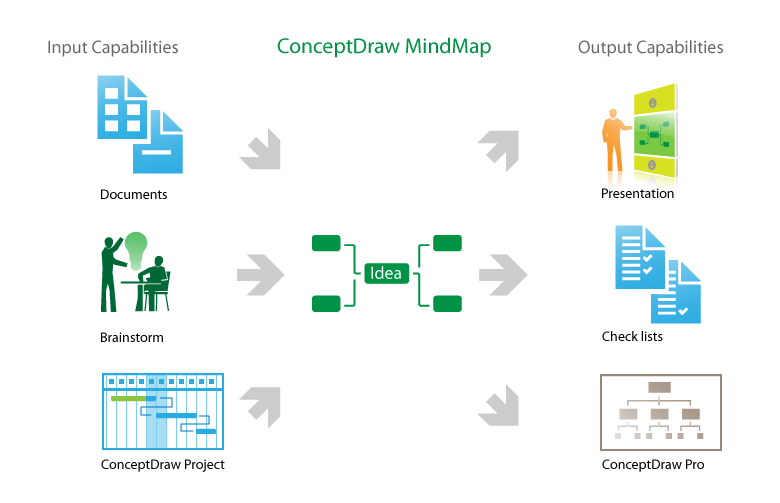
ConceptDraw MINDMAP the will guide you in creating and demonstrating powerful mind map presentations.One formula of professional mind mapping : input data + output data + make great presentation
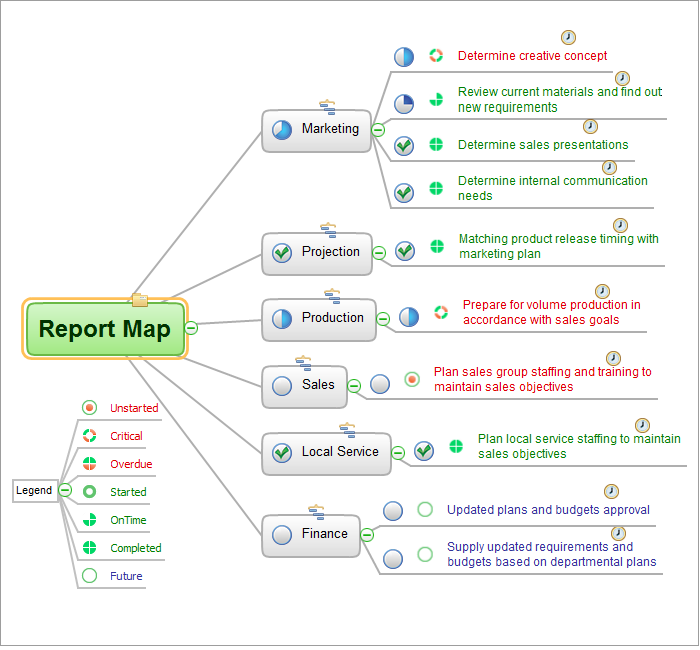
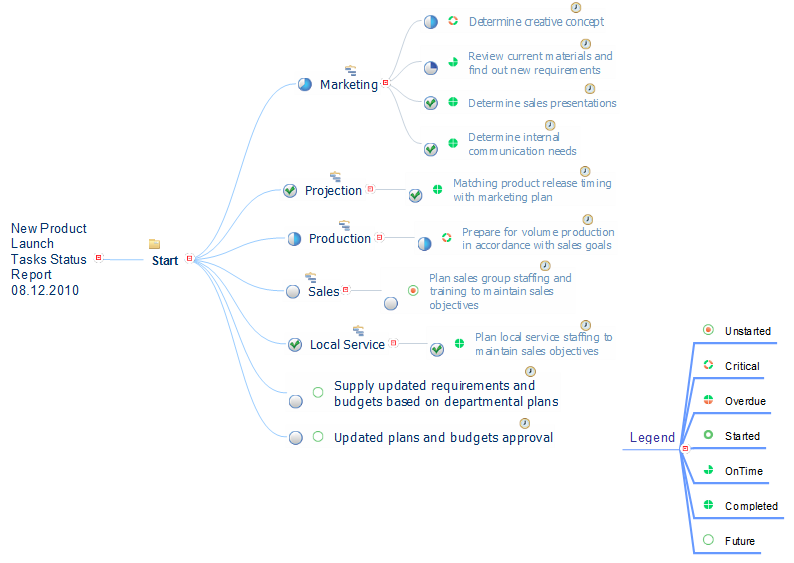
ConceptDraw MINDMAP is a powerful software from ConceptDraw Office suite, which provides a lot of tools and components for professional Mind Mapping. Besides the extensive tools for creation attractive and great-looking Mind Maps, it offers also wide import capabilities from MS Office files and mind mapping files MindJet MindManager, XMind and FreeMind, extensive export capabilities to common formats, such as PDF, HTML, different graphic formats, the possibility to generate MS Office documents, Project Management reports, PowerPoint presentations and demonstrate them via Skype conference call. Use of Skype conference call feature lets you to demonstrate the presentation's slide show and control it on computers of Skype call participants. This Report Mind Map example created in ConceptDraw MINDMAP software depicts the current project status and includes many pages and slides. This Project Status Report can be easy played as a slide show presentation on the large screen or to remote team using Skype conference call.Basic Flowchart Symbols and Meaning
Flowcharts are the best for visually representation the business processes and the flow of a custom-order process through various departments within an organization. ConceptDraw DIAGRAM diagramming and vector drawing software extended with Flowcharts solution offers the full set of predesigned basic flowchart symbols which are gathered at two libraries: Flowchart and Flowcharts Rapid Draw. Among them are: process, terminator, decision, data, document, display, manual loop, and many other specific symbols. The meaning for each symbol offered by ConceptDraw gives the presentation about their proposed use in professional Flowcharts for business and technical processes, software algorithms, well-developed structures of web sites, Workflow diagrams, Process flow diagram and correlation in developing on-line instructional projects or business process system. Use of ready flow chart symbols in diagrams is incredibly useful - you need simply drag desired from the libraries to your document and arrange them in required order. There are a few serious alternatives to Visio for Mac, one of them is ConceptDraw DIAGRAM. It is one of the main contender with the most similar features and capabilities.
Exam Preparation Mind Map
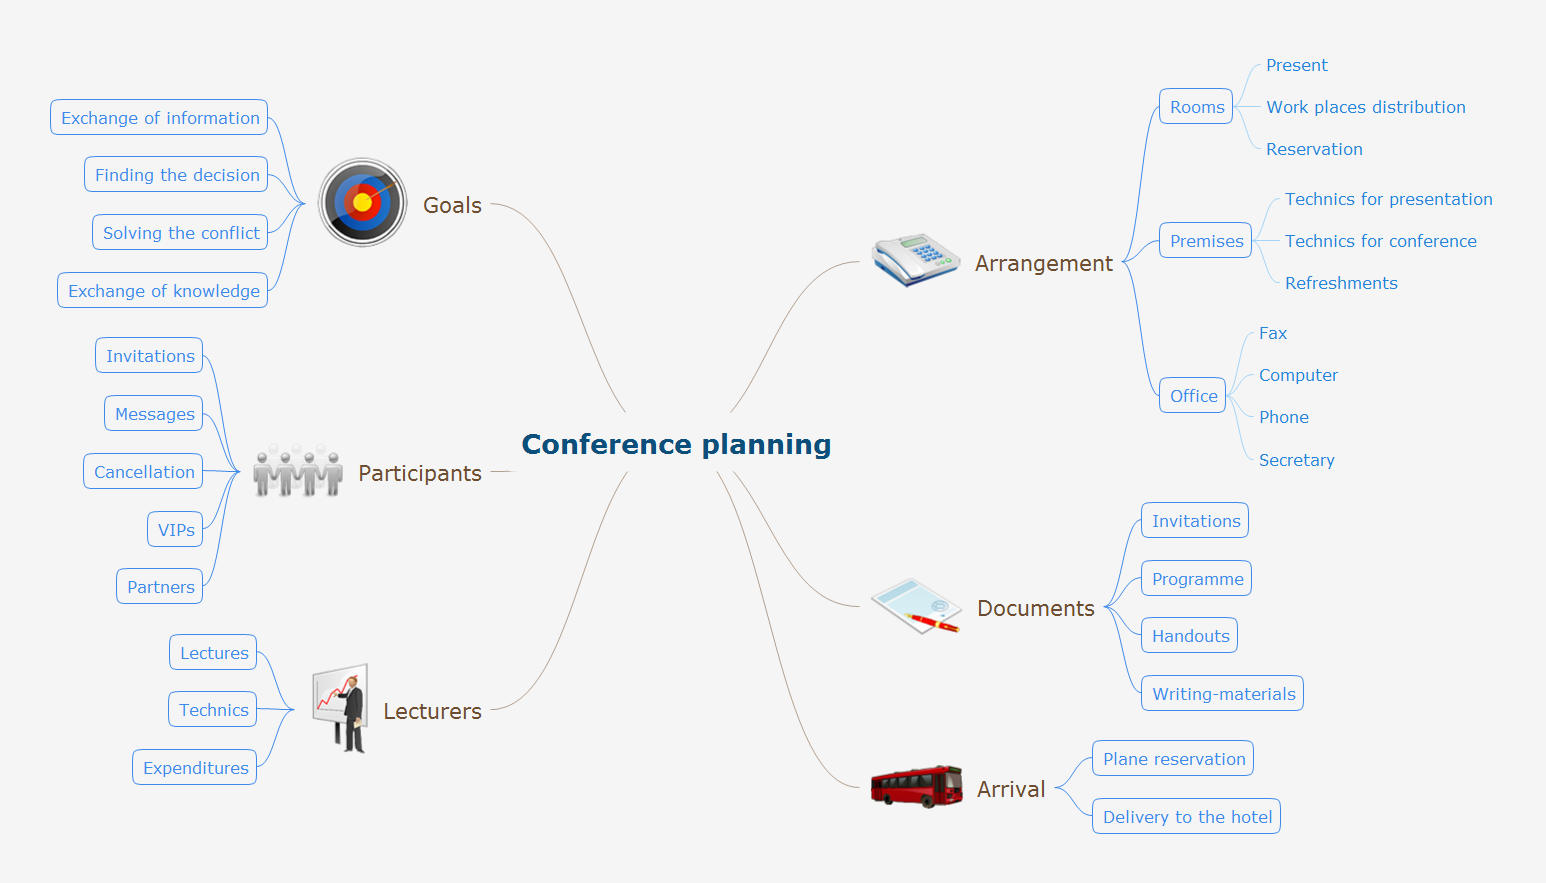
Mind Map is a way to effectively visualize the complex knowledge, to simplify and accelerate the learning and teaching processes. In this way Mind Maps are always in demand in a lot of spheres, among them business, education, engineering, software development, and many others. Mind Maps are perfect for illustration the documents, reports, textbooks, websites, education materials, lectures, etc. The ConceptDraw MINDMAP professional software from ConceptDraw Office suite provides a lot of powerful tools for brainstorming and designing colorful and attractive Mind Maps, drawings and charts, which ideally suit for structuring information and its representation in a visual and comprehensive form. To prepare effectively for examination, you need organize yourself and also clearly understand the correct sequence of actions. This Mind Map created in ConceptDraw MINDMAP application illustrates the main items during the exam preparation process. The use of predesigned cliparts lets to make your Mind Maps illustrative, colorful and attractive.How to Use Skype for Sharing Documents
Sharing Documents Trough Skype: Share files, manage projects, inspire ideas, connect people.
How To Create Onion Diagram
An onion diagram is a kind of chart that shows the dependencies among parts of an organization or process. The chart displays items in concentric circles, where the items in each ring depend on the items in the smaller rings. The Onion Diagram is able to show layers of a complete system in a few circles. But how to create Onion Diagram? Now, it's very easy thanks to the ConceptDraw DIAGRAM diagramming and vector drawing software extended with Stakeholder Onion Diagrams Solution from the Management Area of ConceptDraw Solution Park.How To Send Presentation via Skype (Mac OS X)
New way to present documents via Skype conference call on Mac. All participants receive files. Presentation can be created automatically from plenty document formats.
Best Mind Mapping Program for Making Presentations
ConceptDraw MINDMAP with the ability to import presentations from Microsoft PowerPoint, as well as enhancing its existing presentation capabilities.Professional & Powerful Mind Mapping Software
ConceptDraw MINDMAP is the most productive tool you can use to solve problems and generate yout great ideas.Cross-Functional Flowchart
Use of Cross-Functional Flowchart is a clear way of showing each team member’s responsibilities and how processes get shared or transferred between different responsible people, teams and departments. Use the best flowchart maker ConceptDraw DIAGRAM with a range of standardized cross-functional flowchart symbols to create the Cross-Functional Flowcharts simply and to visualize the relationship between a business process and the functional units responsible for that process. To draw the most quickly Cross-Functional Flowcharts, Cross Functional Process Maps, or Cross Functional Process Flow Diagrams, start with a Cross-functional flowchart samples and templates from ConceptDraw Solution Park. The ConceptDraw Arrows10 and RapidDraw technologies will be also useful for you in drawing. ConceptDraw DIAGRAM supports designing both types - horizontal and vertical Cross-functional flowcharts. A vertical layout makes the accents mainly on the functional units while a horizontal layout - on the process. If you need a Visio alternative in Mac OS X, try ConceptDraw DIAGRAM. Its interface is very intuitive and it’s actually much easier to use than Visio, yet somehow it’s just as powerful if not more so. ConceptDraw DIAGRAM performs professional quality work and seamless Visio interaction.
ConceptDraw DIAGRAM Comparison with Omnigraffle Professional and MS Visio
ConceptDraw DIAGRAM comparison with Omnigraffle Professional and MS Visio shows you the significant benefits of ConceptDraw DIAGRAM , which offers varied useful drawing tools, the capability of creation multi-page documents, wide export / import capabilities in graphics formats, integration with Visio and Microsoft Office applications, availability of built-in scripting language and ConceptDraw Solution Park with numerous solutions, vector objects libraries, templates and samples. Business today is conducted with incredible rate and dynamic presentations become very popular. Sometimes while conducting the business, may happen that you can't describe some situation, state, or process with only words. In these cases, it is convenient to include graphics and diagrams associated with the text. This guarantees successful communication with other stakeholders and team members, and faultless understanding the information by them. The combination of words and graphics is an ideal combination, it improves the clarity and removes any doubt. ConceptDraw DIAGRAM helps you easily create any kinds of diagrams and dynamic presentations too.Looking at ConceptDraw MINDMAP as a Replacement for Mindjet Mindmanager
The comparing of ConceptDraw MINDMAP to Mindjet Mindmanager allows to identify a lot of benefits. At first, the ConceptDraw MINDMAP has a lower price, the flexible licensing, the license is per-named-user, no charge for major product upgrades and no charge for support. ConceptDraw MINDMAP is effective for launching the stalled projects to new heights, it possess the excellent possibility of importing and exporting to other mind mapping program file formats. ConceptDraw MINDMAP easily integrates with wide set of programs, among them Evernote, Skype, Twitter, Microsoft Word, Microsoft PowerPoint, Microsoft Project, Mindjet Mindmanager, ConceptDraw PROJECT, ConceptDraw DIAGRAM , with solutions from ConceptDraw Solution Park. Now you have a freedom to choose the best format for each your document, it is incredibly easy to make the Skype presentation, to take and share critical information, to send your Mind Map to Evernote, to import / export MS Word documents, MS PowerPoint presentations, the project data, open and save Mindmanager files, to map out the long-term Twitter messages and publish them to your Twitter account directly from a Mind Map.Astronomy Symbols
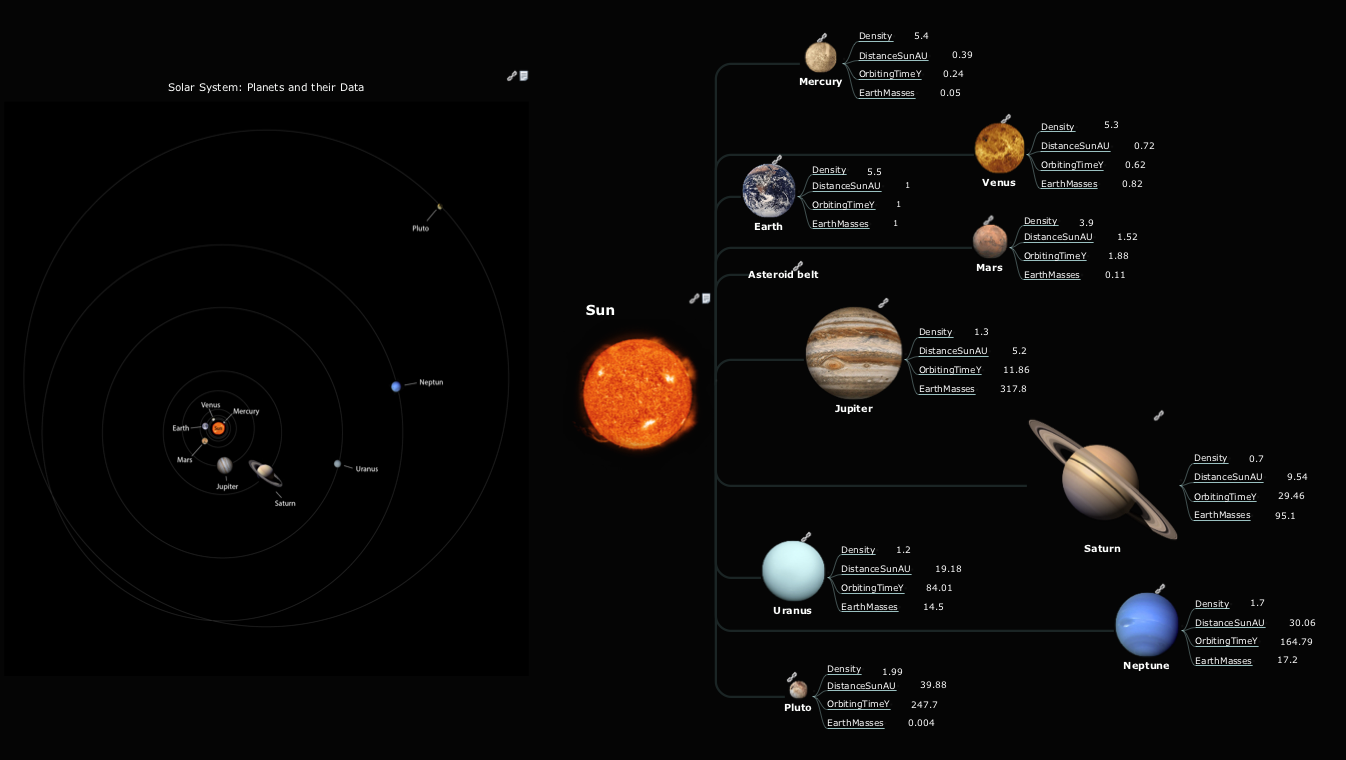
Are you an astronomer, astronomy teacher or student? And you need to draw astronomy pictures quick and easy? ConceptDraw DIAGRAM diagramming and vector drawing software extended with Astronomy solution from the Science and Education area will help you! Astronomy solution provides 7 libraries with wide variety of predesigned vector objects of astronomy symbols, celestial bodies, solar system symbols, constellations, etc.Pie Chart Word Template. Pie Chart Examples
The Pie Chart visualizes the data as the proportional parts of a whole and looks like a disk divided into sectors. The pie chart is type of graph, pie chart looks as circle devided into sectors. Pie Charts are widely used in the business, statistics, analytics, mass media. It’s very effective way of displaying relative sizes of parts, the proportion of the whole thing.- Draw The Flowchart In Ms Word To Buy Stationery Form The Market
- Process Flowchart | Draw A Flow Chart In Ms Word To Buy ...
- How to Add a Flowchart to MS Word Document | How to Add a Cross ...
- Word Exchange | How To Create Dfd In Microsoft Word
- How to Add a Cross-Functional Flowchart to an MS Word Document ...
- Process Flowchart | How To Create Restaurant Floor Plan in ...
- Flowcharts in Word | How to Add a Cross-Functional Flowchart to an ...
- How to Add a Cross-Functional Flowchart to a PowerPoint ...
- How to Add a Workflow Diagram to MS Word Document | Flowchart ...
- How to Add a Workflow Diagram to a MS Word Document Using ...
- How To Copy Block Diagram From Word To Powerpoint
- Building Management System Flowchart For Admin
- Flowchart To Buy Stationery From Market
- How To Draw Block Diagram In Microsoft Powerpoint
- How to Present an MS Word Document via Skype | How to Present a ...
- How to Add a Business Process Diagram to a MS Word Document ...
- Organizational Chart In Word
- How to Insert a Mind Map into Microsoft Word Document | How to ...
- Free Sipoc Diagram Template For Word Powerpoint Pdf
