Software for flowchart diagrams
Using ConceptDraw DIAGRAM is the fastest way to create flowcharts. Select one of ready-to-use templates to represent your process automatically using RapidDraw objects with no need to drag icons from library, connect them and edit their format - ConceptDraw DIAGRAM will do this for you.
We prepared a broad set of flowcharting symbols, so either you are new to drawing or professional, you will find any pre-designed object to proceed.
Sharing to PDF, Microsoft PowerPoint® and other popular formats with your team is just once click from the Export menu. Presentation mode turns your tool into handy solution for a meeting.
ConceptDraw DIAGRAM extended with Flowcharts Solution from the "Diagrams" Area is the ideal Software for flowchart diagrams.

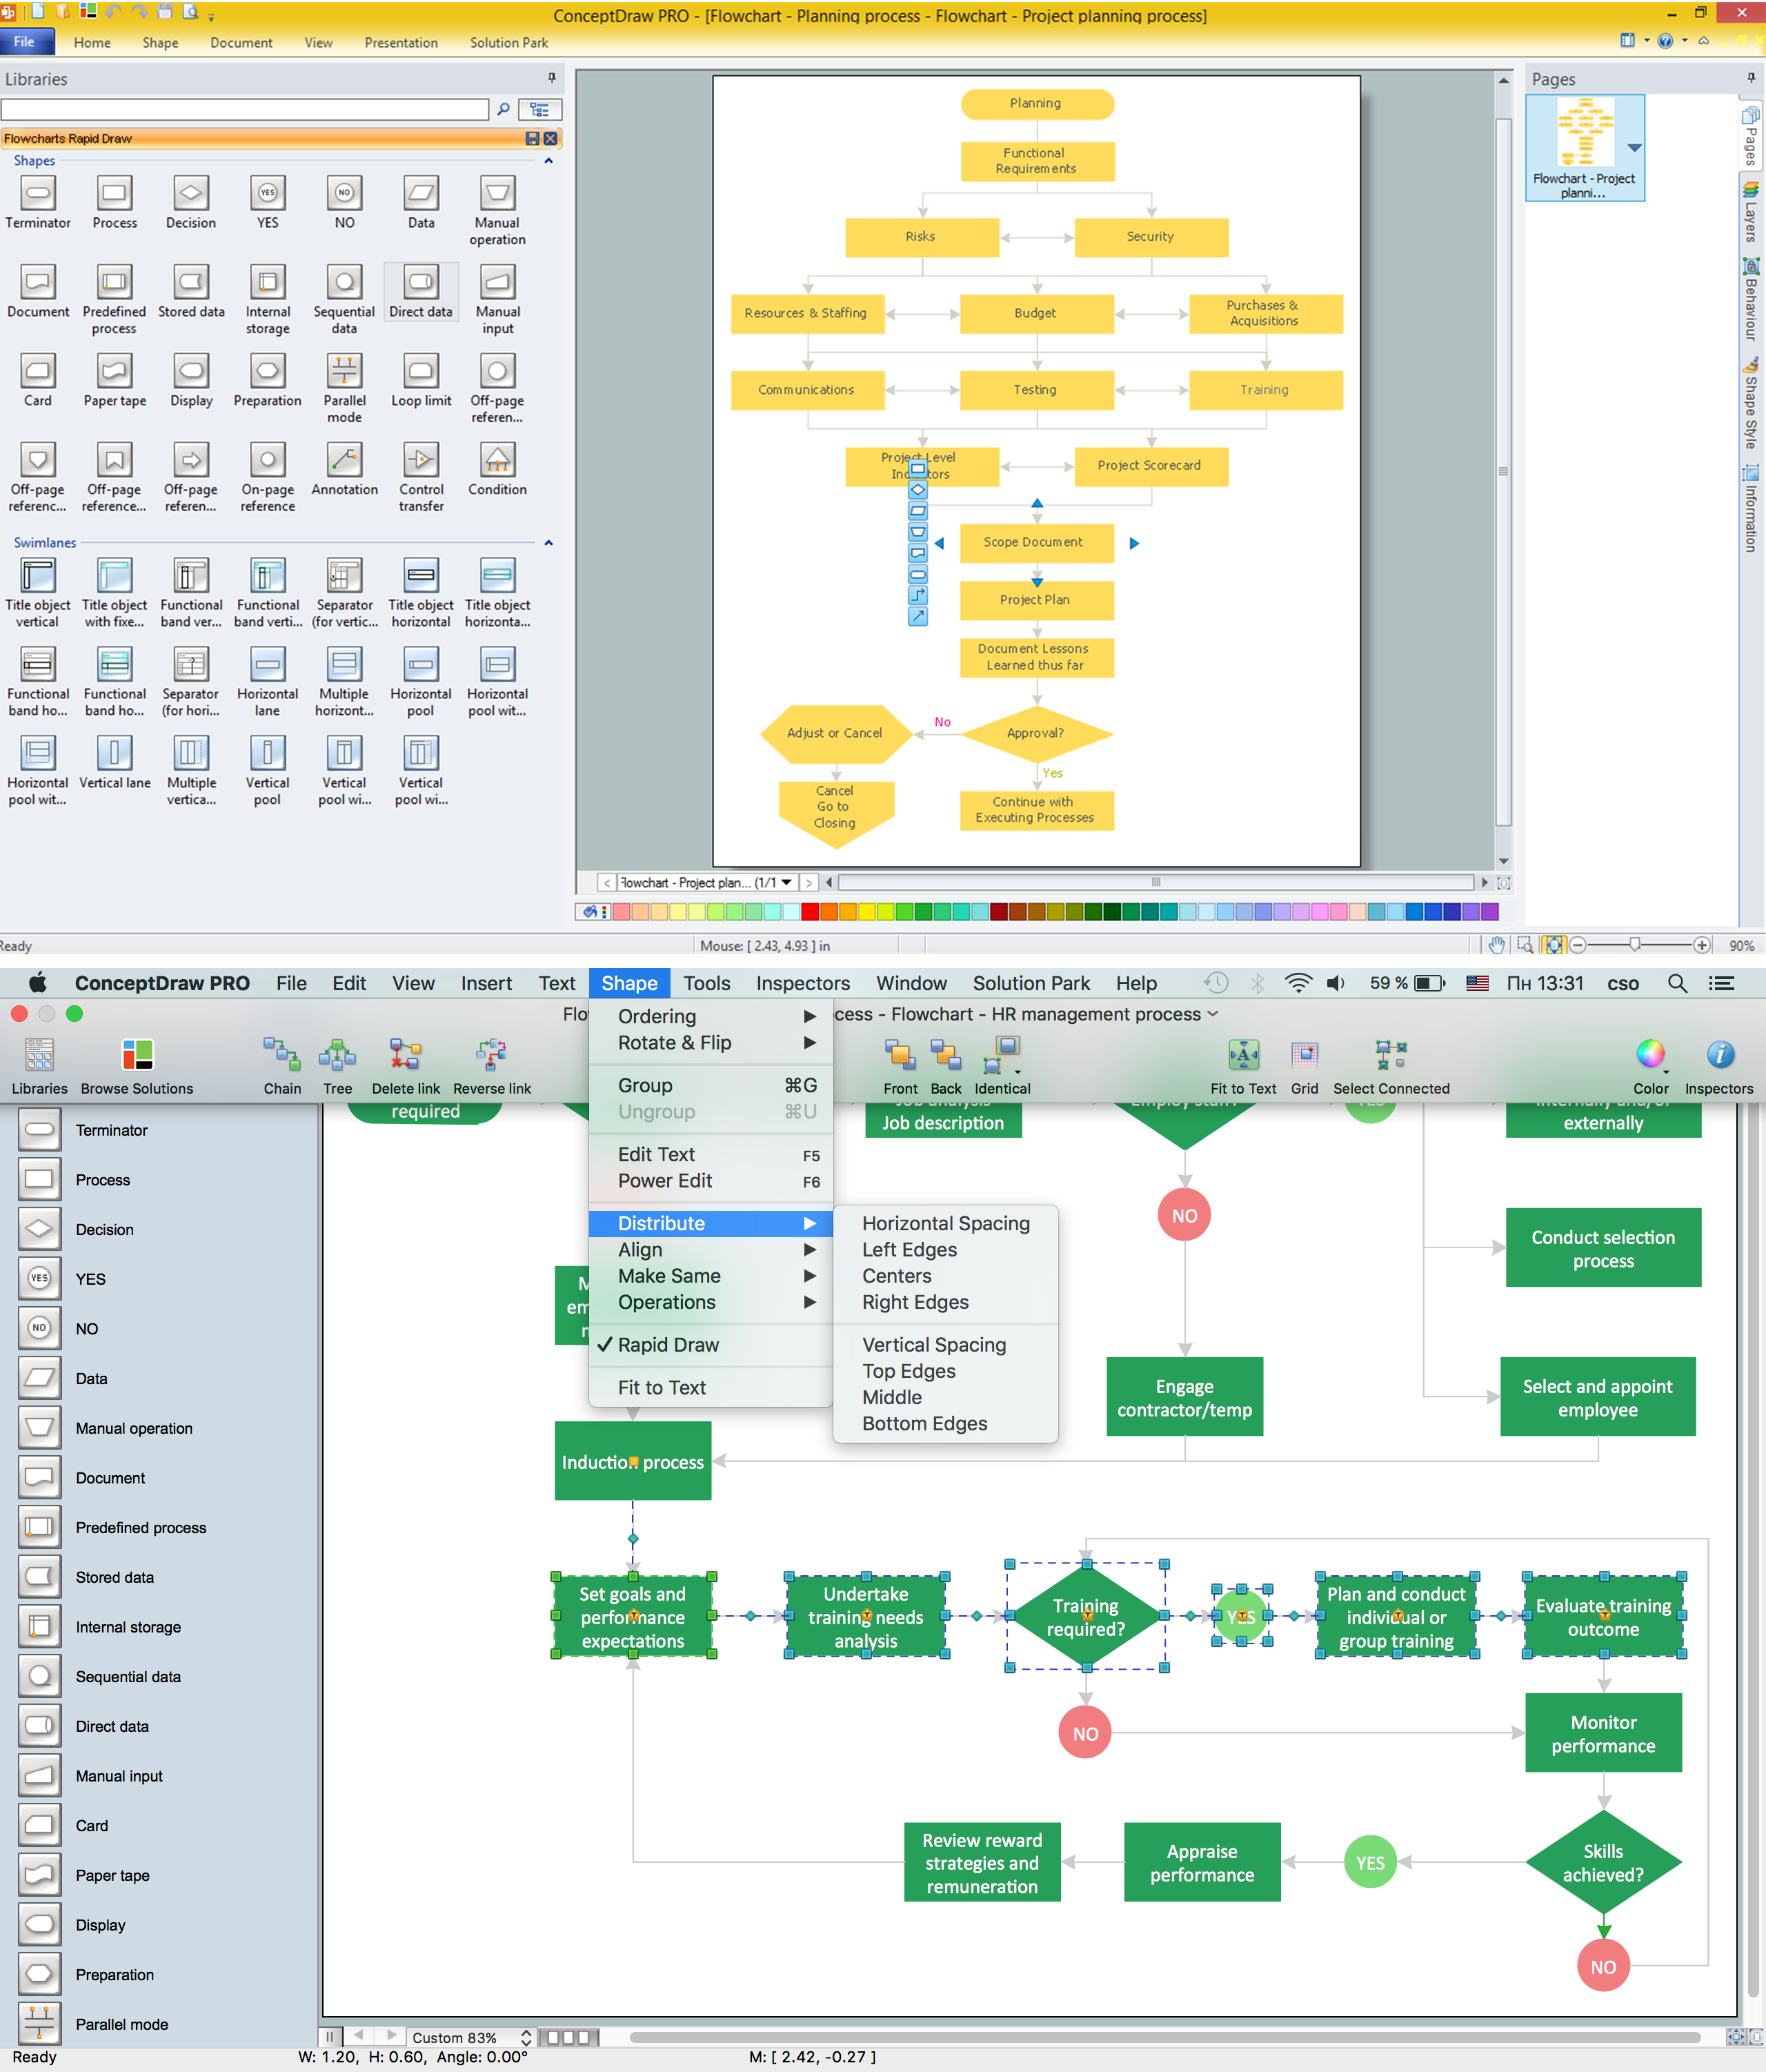
Example 1. Flowchart diagrams solution
Flowchart Diagrams Symbols
The Flowcharts Solution from the "Diagrams" area of ConceptDraw Solution Park contains a wide set of predesigned templates, samples and 3 libraries:
- Flowchart - This vector stencils library contains 26 symbols for drawing flowcharts.

- Flowchart Rapid Draw - This library contains graphical objects used for creating flowcharts, top-down diagrams, information tracking diagrams, process planning diagrams, and structure-prediction diagrams.

- Flowcharts Rapid Draw (Swimlane Flowcharts) - This library contains vector shapes for drawing flowcharts.

The libraries of Flowcharts Solution include a great number of ready-to-use predesigned vector symbols that will help you design the professional looking flowchart diagrams in minutes.
Flowchart Diagrams Template
Professionally-designed flowchart examples make you instantly productive. Simply choose the flowchart template that is most similar to your project, and customize it to suit your needs.

Example 2. Flowchart Diagrams Template
Cross-Platform Compatibility
The main advantage, of course, is that ConceptDraw DIAGRAM is a cross-platform software. That means it can be run both on PC, and on Apple Macintosh!
Example 3. Software for flowchart diagrams (Windows®, Mac OS X®)
Seamless integration with the Tools You Already Use
The Flowcharts diagrams with ConceptDraw DIAGRAM are vector graphic documents and are available for reviewing, modifying, converting to a variety of formats (image, HTML, PDF file, MS PowerPoint® Presentation, Adobe Flash or MS Visio®), printing and send via e-mail in one moment.
Software for flowchart diagrams can help you
- Represents an algorithm or process,
- Illustrates a solution to a given problem,
- Represented Process operations,
- Analyzing a business process,
- Designing a business process,
- Documenting a business process,
- Optimizing a business process.
TEN RELATED HOW TO's:
Interactive Voice Response (IVR) is a system of the prerecorded voice messages that allows a computer to interact with humans. IVR performs the function of the routing calls within a call center, using the information entered by the customer on the phone keypad in the touchtone mode.
This example was created in ConceptDraw DIAGRAM using the Computer and Networks Area of ConceptDraw Solution Park and show the Interactive Voice Response (IVR) network.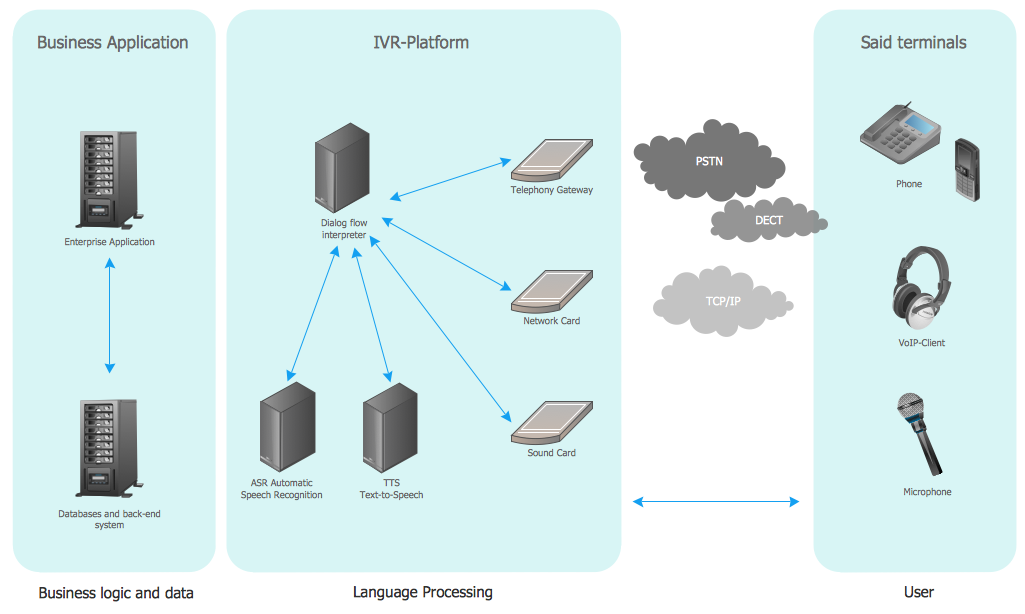
Picture: Interactive voice response (IVR) networks. Computer and Network Examples
Related Solution:
The audit process is a definite set of steps used in a financial, operational or compliance audit. This set of steps depends of the audit services company. The auditing process usually includes three main steps: planning, fieldwork and reporting.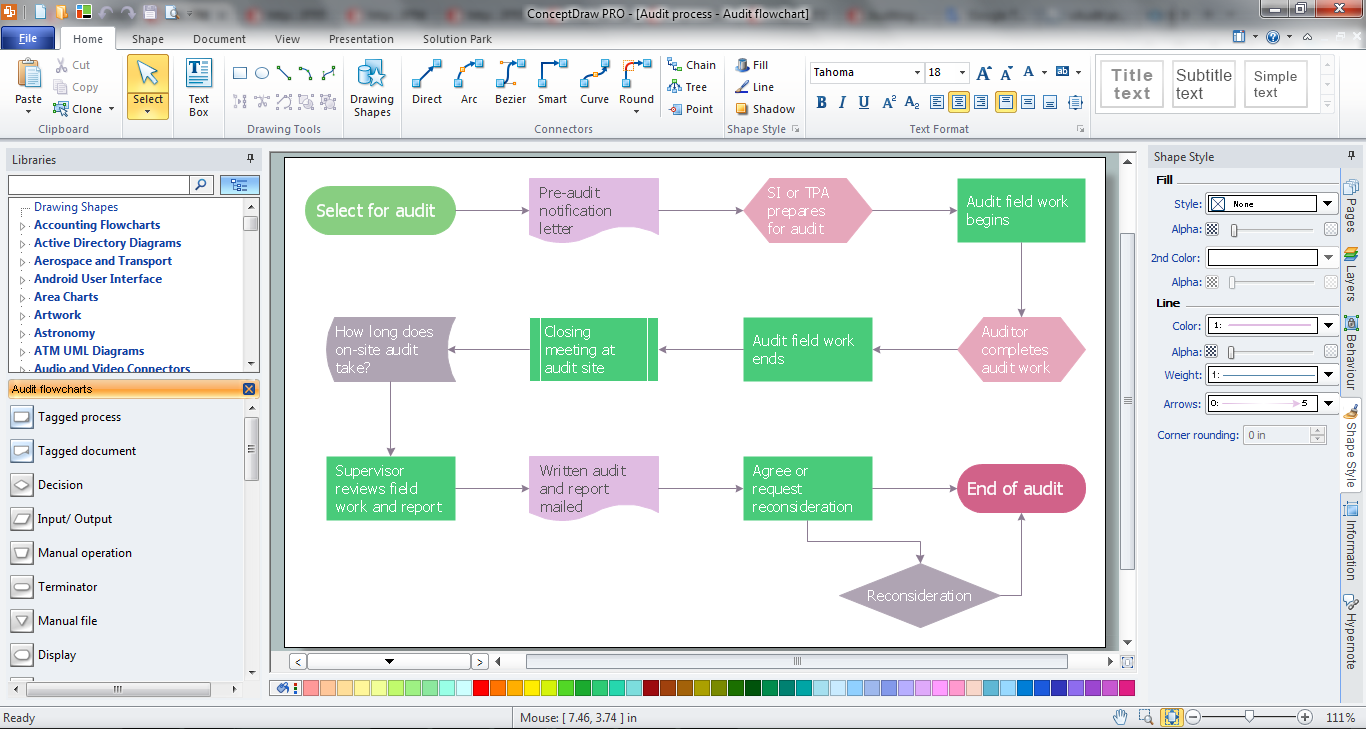
Picture: Audit Process
Related Solution:
Use ConceptDraw DIAGRAM software as a powerful audit application. 🔸 Create professional Audit Workflow Diagrams and Audit Process Flowcharts to ✔️ plan and implement audit process, ✔️ enhance financial transparency, ✔️ improve financial reporting, ✔️ streamline operations, ✔️ improve business efficiency, ✔️ identify risks and issues, ✔️ prevent financial fraud, ✔️ track progress, ✔️ enhance trust
Picture: Understanding the Audit Process: A Comprehensive Guide. Audit Process Flowchart
Related Solution:
These libraries of vector objects depict the Site Accessories and Parking and Roads elements. They are needed to draw architectural and landscape plans that show the architectural elements around buildings: parking spaces, hiking and biking trails, drainage systems, lights, and vehicle access control elements. These libraries are included into ConcepDraw solution for Site Planning. Site Accessories and Parking, Roads libraries contain near 40 vector images that will help depict an a surrounding territory at building plans.
These libraries of vector objects depict the Site Accessories and Parking and Roads elements. They are needed to draw architectural and landscape plans that show the architectural elements around buildings: parking spaces, hiking and biking trails, drainage systems, lights, and vehicle access control elements. These libraries are included into ConcepDraw solution for Site Planning. Site Accessories and Parking, Roads libraries contain near 40 vector images that will help depict an a surrounding territory at building plans.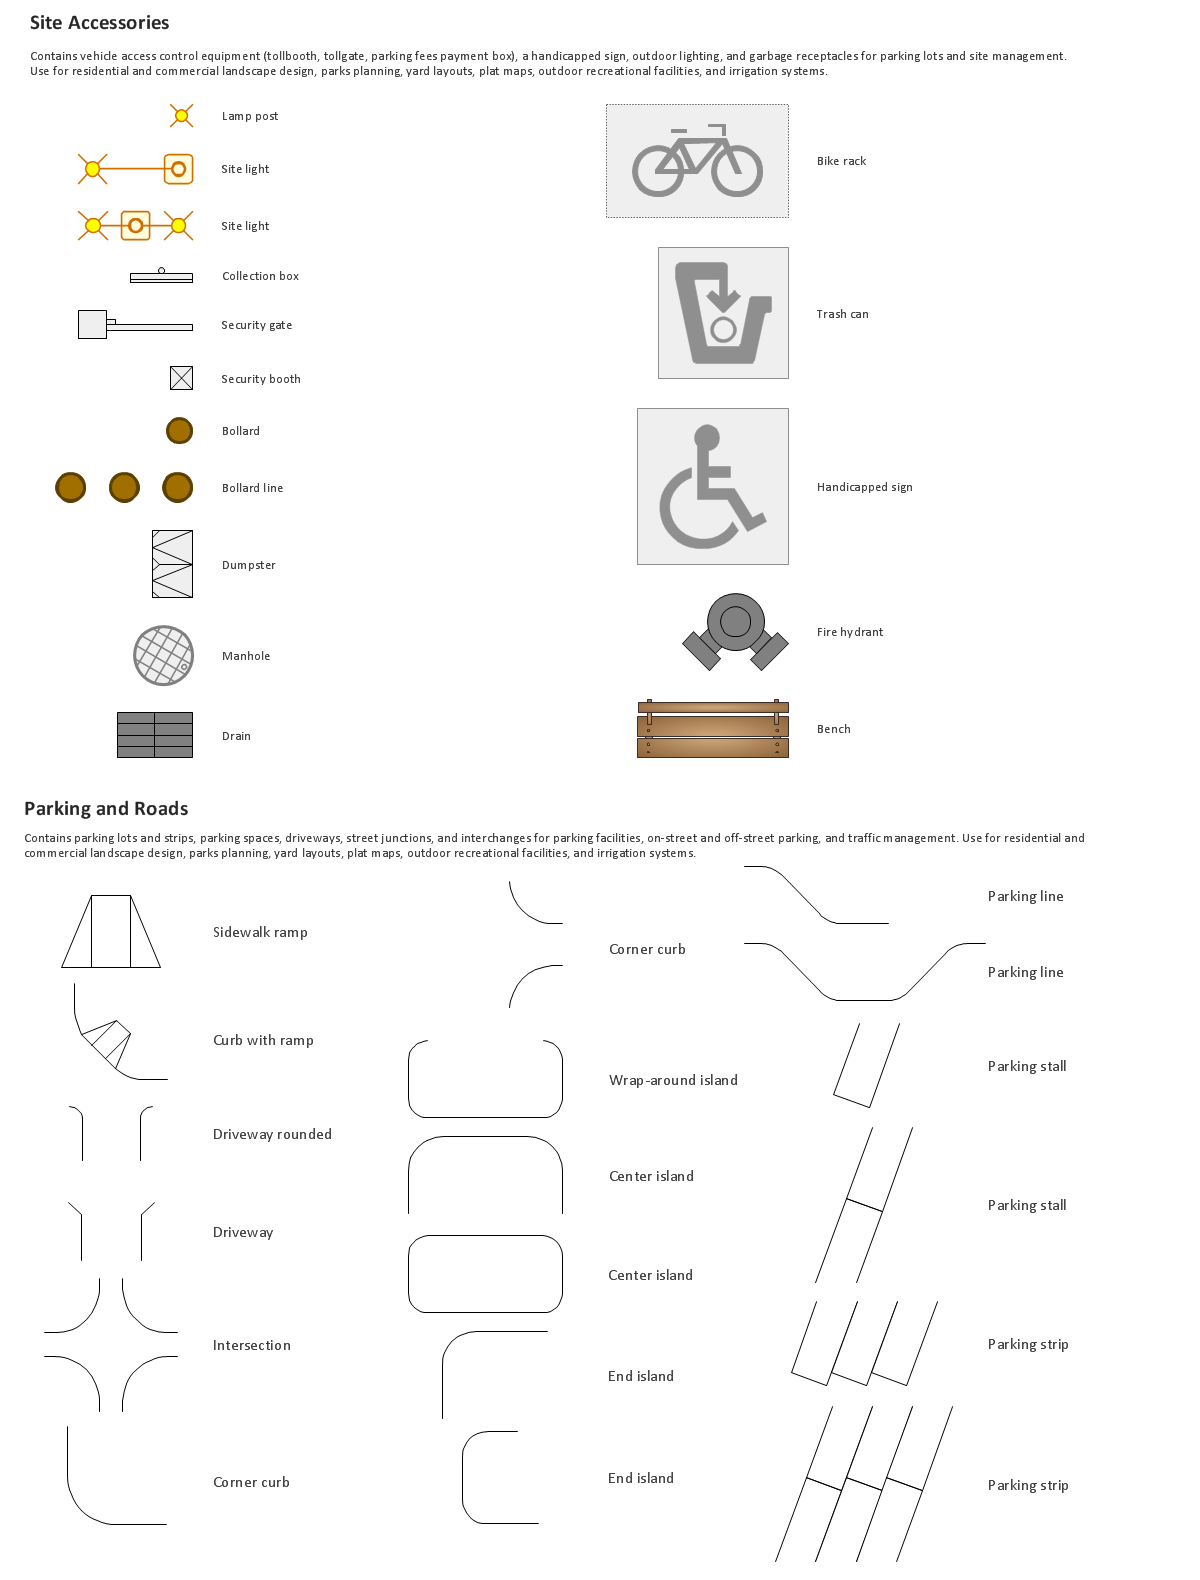
Picture: Building Drawing. Design Element Site Plan
Related Solution:
ConceptDraw DIAGRAM is workflow diagram software enhanced by numerous extentions from ConceptDraw Solution Park. It inludes many professional workflow diagrams, examples and ready to use workflow diagram and workflow symbols. Workflow symbol collections include symbols for Processes, Planning, Scheduling, Flow Control, In-Transit Process Visibility.
The best workflow diagram software you may find is ConceptDraw DIAGRAM. ConceptDraw DIAGRAM is world-known diagramming software that works for both Windows and Mac OS X platforms. The software contains complete set of features allows to draw diagrams faster. ConceptDraw DIAGRAM extended with the Workflow Diagram solution provides additional libraries, templates and samples for drawing professional workflow diagrams.
Picture: Workflow Diagram Software
Related Solution:
UML Timing Diagram as special form of a sequence diagram are used to explore the behaviors of objects throughout a given period of time.
Picture: Diagramming Software for Design UML Timing Diagrams
Sales process engineering is a complex and labour-intensive process which requires a lot of time, efforts, and powerful software. We recommend to use the ConceptDraw DIAGRAM software enhanced with Sales Flowcharts solution from the Marketing area of ConceptDraw Solution Park. It gives the possibility to easy illustrate all sales process steps and their results.
Picture: Sales Process Steps
Related Solution:
The activity of any organization is more or less branchy network of processes. The description of these processes is a hard technical task which requires definite methodology and standards.
According to the IDEF0 standard any process can be described in the form of a block (Activity Box) which has inputs and outputs. The process consists in transformation of inputs into outputs under the influence of the management and in the presence of necessary resources. Outputs of the given process later on can be either inputs for the next process or resources, or management means.
Picture: IDEF0 standard with ConceptDraw DIAGRAM
Related Solution:
Long time you have looked for the convenient and helpful software for drawing HVAC Business Plan? Now ConceptDraw DIAGRAM diagramming and vector drawing software offers you the HVAC Plans Solution from the Building Plans Area that will help you create any desired HVAC Business Plan.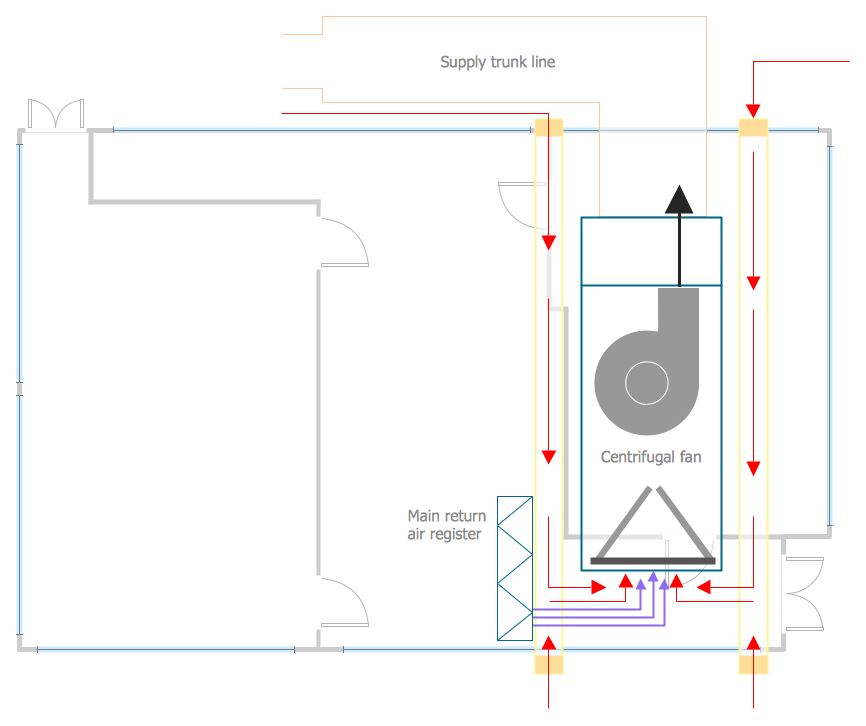
Picture: HVAC Business Plan
Related Solution:
Use the libraries from the Block Diagrams solution to draw block diagrams for your business documents, presentations and websites in a few minutes.
Picture: Block Diagram
Related Solution:


