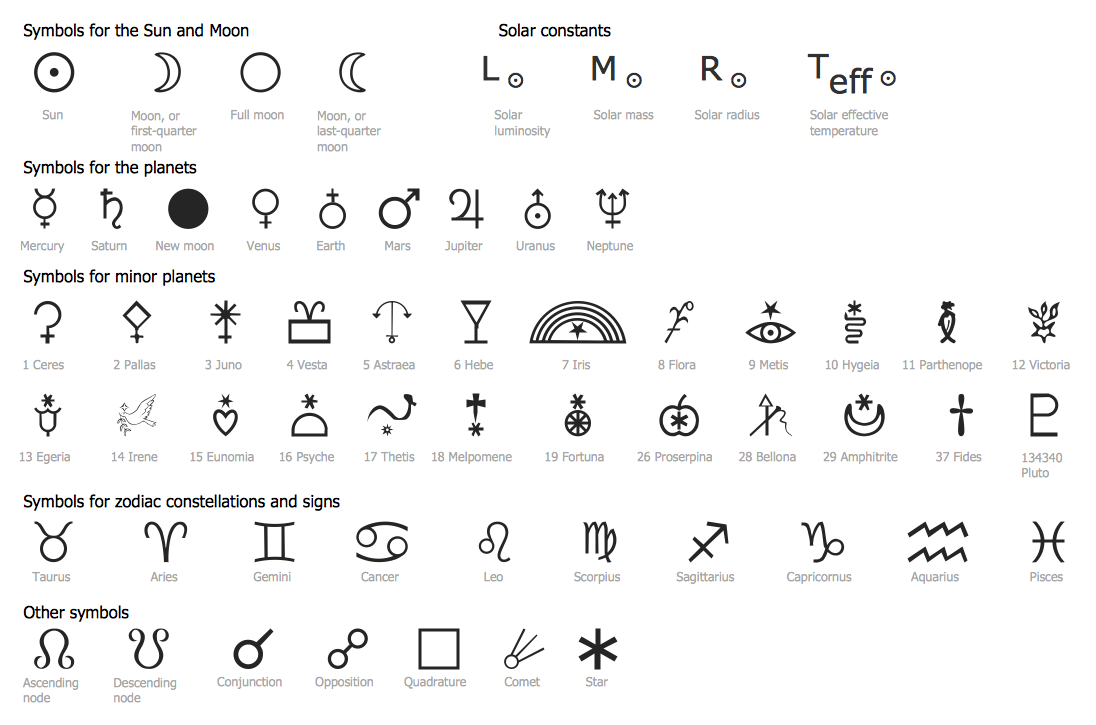
Sample 1. Astronomy Symbols – Astronomical Symbols Library Design Elements
Astronomical Symbols library contains 59 vector objects, these are:
- symbols for the Sun and Moon,
- solar constants,
- symbols for the planets,
- symbols for minor planets,
- symbols for zodiac constellations and signs,
and some other astronomy symbols.
Use astronomy symbols from the Astronomical Symbols library to draw professional looking astronomy and astrology illustrations and then successfully use them.
You can also use the predesigned templates and samples which are available from the ConceptDraw STORE. It’s the most quick way of drawing any illustration – simply open the desired template and fill it, add objects from the libraries and type the text.

Sample 2. Astronomy Solution in ConceptDraw STORE
The astrology and astronomy pictures designed with ConceptDraw DIAGRAM are vector graphic documents and are available for reviewing, modifying, converting to a variety of formats (image, HTML, PDF file, MS PowerPoint Presentation, Adobe Flash or MS Visio), printing and send via e-mail in one moment.
TEN RELATED HOW TO's:
You need design Cylinder Venn Diagram? Nothing could be easier with ConceptDraw DIAGRAM software.
Picture: Cylinder Venn Diagram
Related Solution:
A competent delegation of responsibilities between workers guarantees business success in most cases. At first sight, it might seem that workflow diagram symbols are quite similar to a regular flowchart. But workflow diagram is a more accurate way to present working processes.
Workflow diagrams are helpful for a working process analyzation, to depict a pathway of process issues, personalize responsibilities and identify resources that will help to optimize a workflow. Generally, Workflow diagram deploys flowchart symbols for displaying work process steps and relationships. But, often it require some additions and improvements to become more professional and illustrative. The Workflow solution for ConceptDraw DIAGRAM provides the user with a big library of symbols that are designed especially for workflow diagrams.
Picture: Workflow Diagram Symbols
Related Solution:
Compare flowchart software by type, features, and workflow fit. Learn the difference between desktop and online tools and choose the right solution for documentation or collaboration.
Picture: Flowchart Software: Tools for Process and Workflow Diagramming
Related Solution:
A database is a data collection, structured into some conceptual model. Two most common approaches of developing data models are UML diagrams and ER-model diagrams. There are several notations of entity-relationship diagram symbols and their meaning is slightly different. Crow’s Foot notation is quite descriptive and easy to understand, meanwhile, the Chen notation is great for conceptual modeling.
An entity relationship diagrams look very simple to a flowcharts. The main difference is the symbols provided by specific ERD notations. There are several models applied in entity-relationship diagrams: conceptual, logical and physical. Creating an entity relationship diagram requires using a specific notation. There are five main components of common ERD notations: Entities, Actions, Attributes, Cardinality and Connections. The two of notations most widely used for creating ERD are Chen notation and Crow foot notation. By the way, the Crow foot notation originates from the Chen notation - it is an adapted version of the Chen notation.
Picture: ERD Symbols and Meanings
Related Solution:
The Education Information is multifariuos and can be often represented in various forms. Еру the most successful ways of presentation the information and data are various illustrations, diagrams and colorful education infographics which you can easily make in ConceptDraw DIAGRAM software extended with Education Infographics Solution from the Business Infographics Area.
Picture: Education Information
Related Solution:
Ultra high frequency (UHF) is the ITU designation for radio frequencies in the range between 300 MHz and 3 GHz, also known as the decimetre band as the wavelengths range from one meter to one decimetre. Radio waves with frequencies above the UHF band fall into the SHF (super-high frequency) or microwave frequency range. Lower frequency signals fall into the VHF (very high frequency) or lower bands. UHF radio waves propagate mainly by line of sight; they are blocked by hills and large buildings although the transmission through building walls is strong enough for indoor reception. They are used for television broadcasting, cell phones, satellite communication including GPS, personal radio services including Wi-Fi and Bluetooth, walkie-talkies, cordless phones, and numerous other applications.
26 libraries of the Electrical Engineering Solution of ConceptDraw DIAGRAM make your electrical diagramming simple, efficient, and effective. You can simply and quickly drop the ready-to-use objects from libraries into your document to create the electrical diagram.
Picture: Electrical Symbols — VHF UHF SHF
Related Solution:
Use it to make professional looking documents, presentations, and websites illustrated with color scalable vector clipart for geography, weather, and animals.
Picture: How can you illustrate the weather condition
Working with information can be quite tedious, furthermore, some data can be quite difficult to perceive without any graphic representation. So, to facilitate your work, you can use business diagrams, such as simple flowcharts or Gantt charts for project management and orgcharts for clarifying your company structure. You can use a proper software, like ConceptDraw Pro, draw them on paper, or use whiteboards, but it is more convenient to use a digital tool.
This diagram shows a cross-functional flowchart that was made fore telecom service provider. A workflow of a common telecommunication service provider has a rather branched structure. Thus, it is useful to have a flow chart to visualize the sequences and interrelations of the work flow steps. Business process flowchart contains 17 processes and 4 decision points,that are distributed through 2 lines depicting the participants involved. Also there are connectors that show the data flow within processes. This flowchart displays a detailed model of the telecom service trading process, as well as all participants in the process and how they interact with each other.
Picture: Business diagrams & Org Charts with ConceptDraw DIAGRAM
Create flowcharts, org charts, floor plans, business diagrams and more with ConceptDraw DIAGRAM.
Picture: Simple Diagramming
Related Solution:
eLearning with Skype without attending classes. Skype as a communication and instructional tool allows trainers to meet with students online and run training sessions. Solution which provides effective results.
Picture: Skype - eLearning Learning
Related Solution:
