Example 1. Process Flow Diagrams - Order Processing
Among the tools which provides the Flowcharts Solution are Flowchart and Flowcharts Rapid Draw libraries with variety of ready-to-use vector objects for drawing Process Flow Diagrams and Business Process Flow Diagrams.

Example 2. Flowcharts Solution in ConceptDraw STORE
Flowcharts Solution includes also variety of samples and Basic Flowchart template which can become the perfect start and good example for your self-dependent drawing a Process Flow Diagram of any complexity.

Example 3. Process Flow Diagrams - Import Process
The Process Flow Diagrams you see on this page were created in ConceptDraw DIAGRAM using the Flowcharts Solution for ConceptDraw DIAGRAM software. These samples successfully demonstrate solution's capabilities and professional results you can achieve. An experienced user spent 5-10 minutes creating each of these samples.
Use the Flowcharts Solution for ConceptDraw Solution Park to create professional looking Process Flow Diagrams quick, easy and effective.
All source documents are vector graphic documents. They are available for reviewing, modifying, or converting to a variety of formats (PDF file, MS PowerPoint, MS Visio, and many other graphic formats) from the ConceptDraw STORE. The Flowcharts Solution is available for all ConceptDraw DIAGRAM or later users.
NINE RELATED HOW TO's:
Data Exchange - Tools to exchnage data files of major mindmapping software for team collaboration.
The Mind Map Exchange solution allows you to share mind maps with others who have 3rd party mind map applications.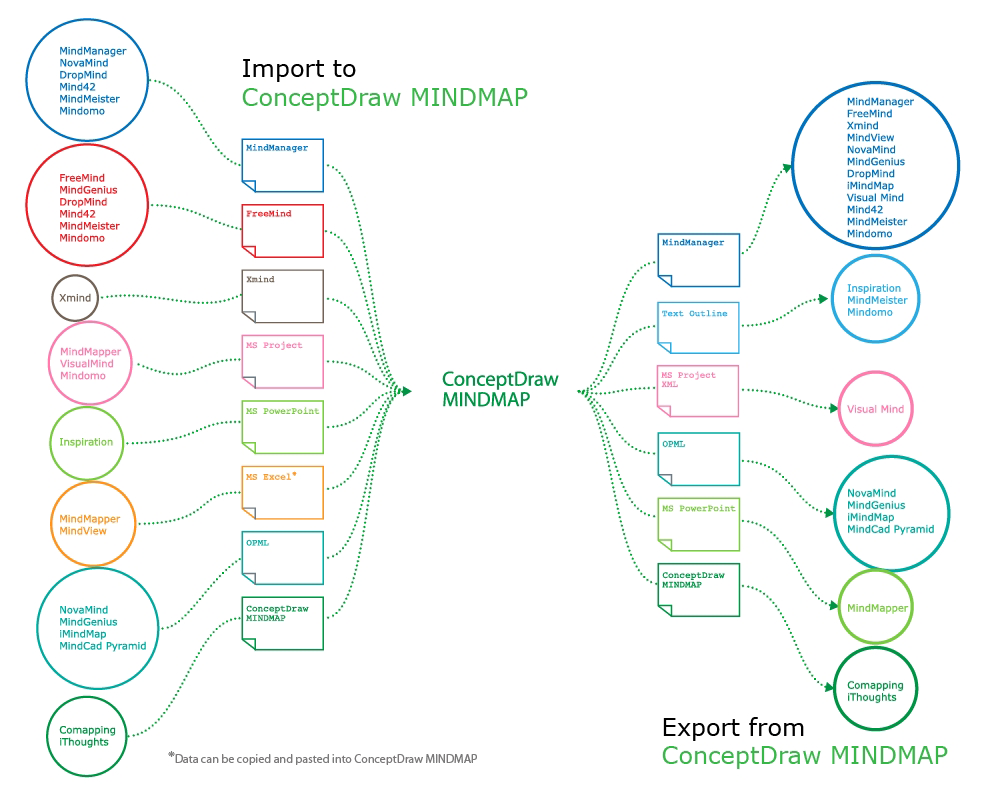
Picture: How to exchange data files of major mind mapping software?
Related Solution:
ConceptDraw DIAGRAM diagramming and vector drawing software extended with Directional Maps Solution from the Maps Area of ConceptDraw Solution Park is a powerful maps and directions design software. Let's review the tools of this solution.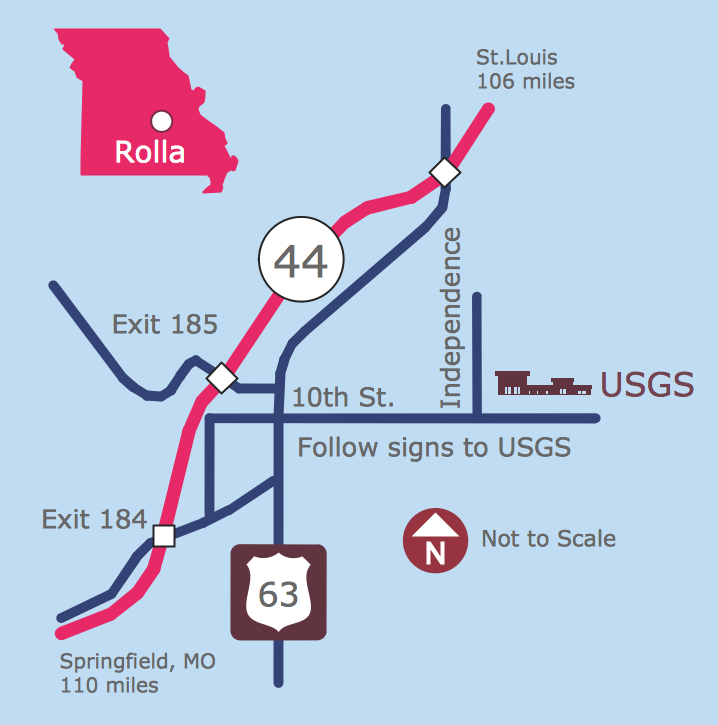
Picture: Maps and Directions
Related Solution:
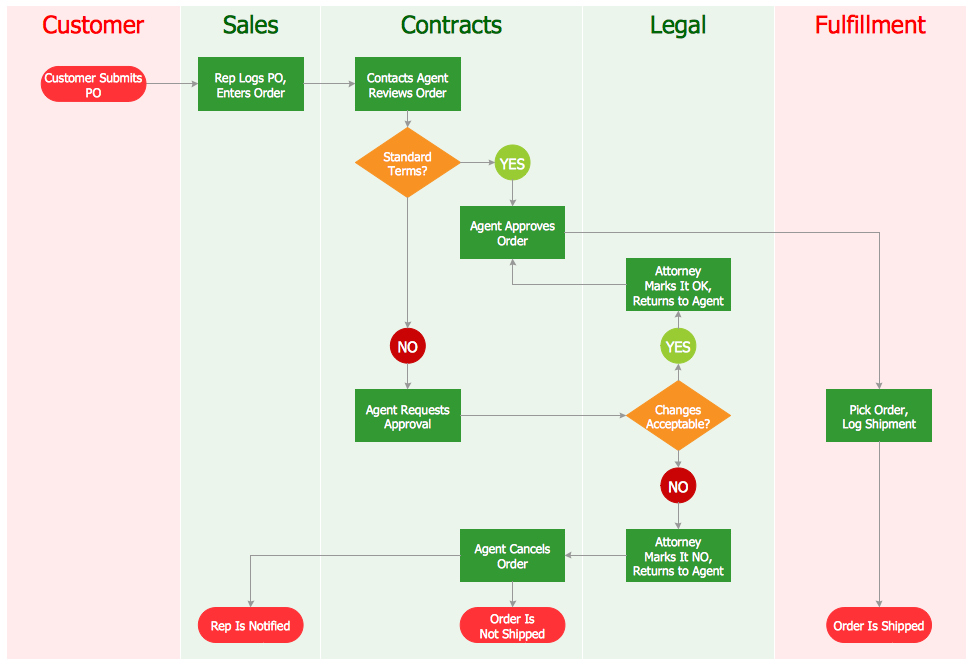
Working with personnel might be difficult if you are not prepared enough. To explain your workers all the details of communication with customers, you can draw an order process flowchart which will describe every step of the process and answer all the questions that might appear. You can view a lot of business process mapping diagram examples here, in ConceptDraw Solution Park.
This business process flow chart is created to illustrate the sample work order process. Before an organization can make some work for a person, the customer work order request must be completed. It is needed for tracking and accountability objectives. We used this business process flowchart to show a certain tasks and actions assumed by an organization. This flowchart depicts the outside inputs that are needed to launch a process, and ways the organization delivers its outputs. This business process flowchart was created with a help of ConceptDraw Business Process Mapping solution.
Picture: Work Order Process Flowchart. Business Process Mapping Examples
Related Solution:
Create flowcharts, flow charts, and more with ConceptDraw flowchart software.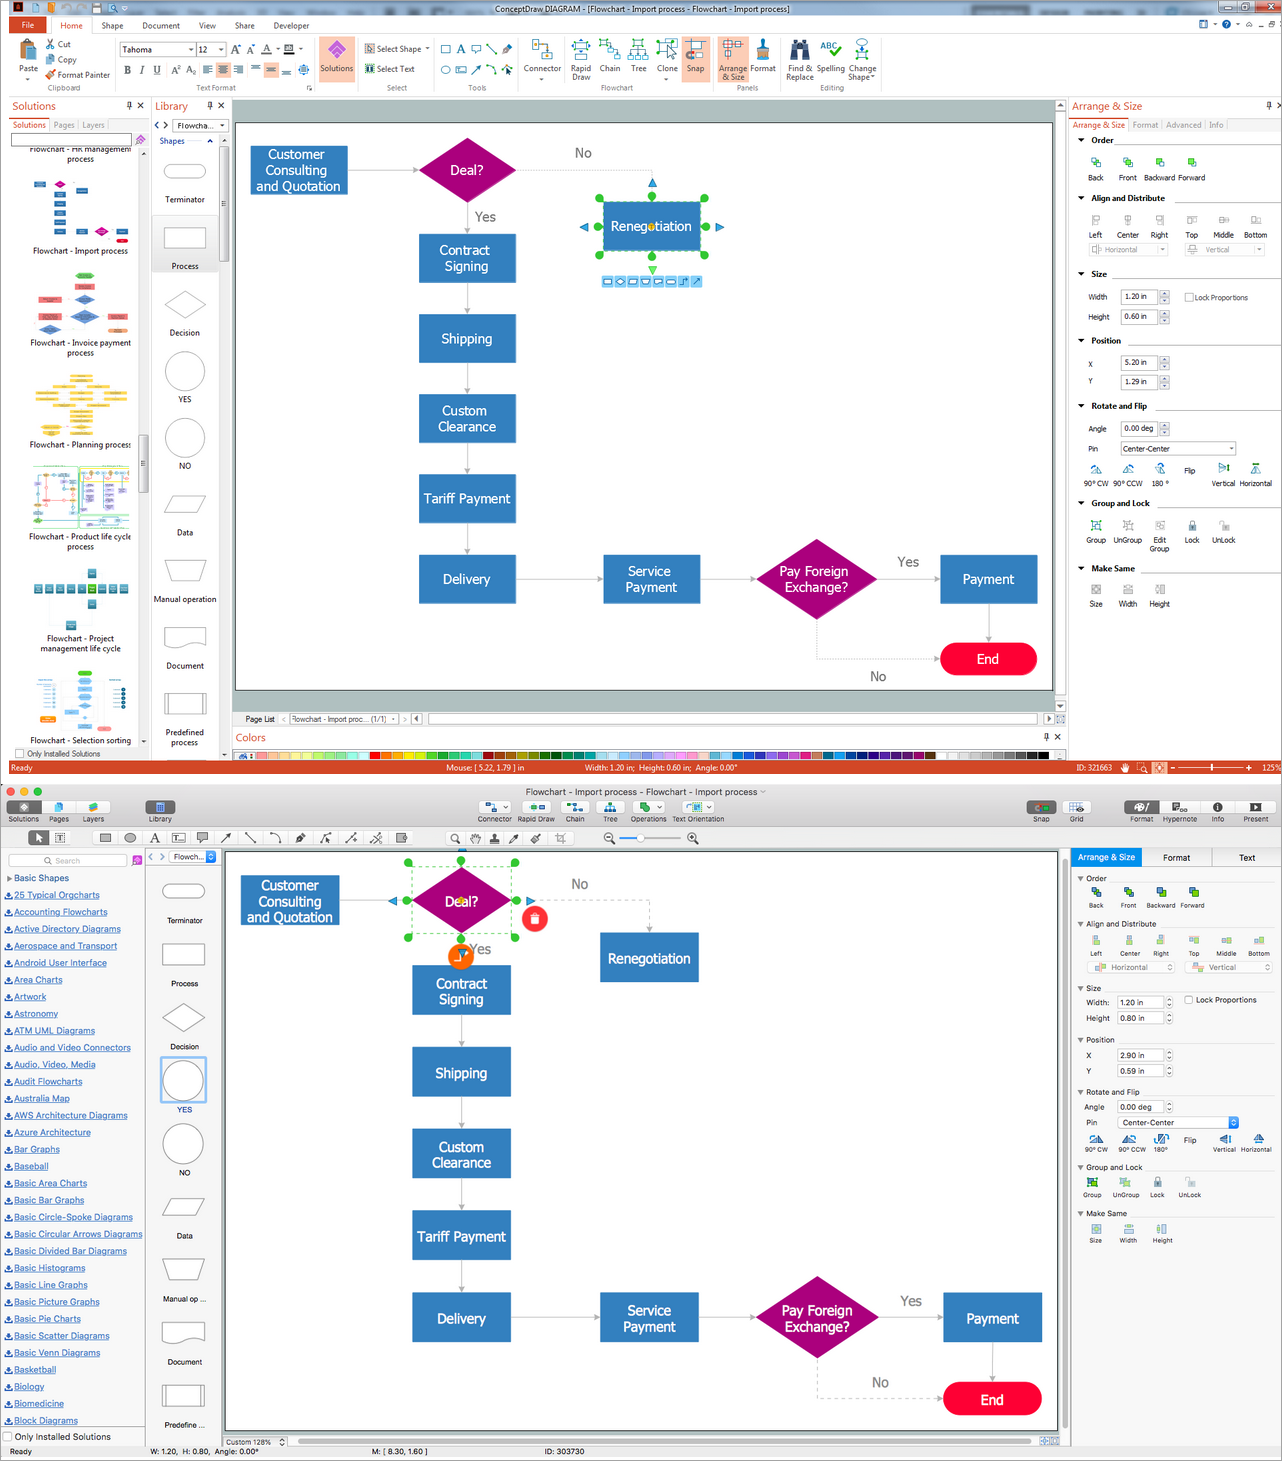
Picture: Basic Diagramming. Flowchart Software
Related Solution:
For those who want to know what is a cross functional flowchart and how to draw it, we preared a special library and professional looking templates.
Take all the advantage of your drawing software to learn and create such a well-designed flowcharts.
Watch the HowTo video to learn more.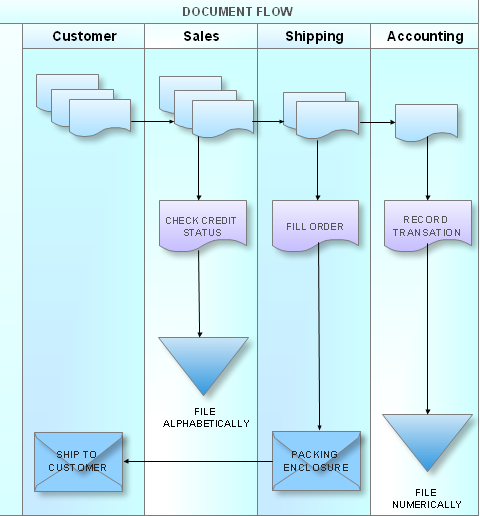
Picture: What is a Cross Functional Flow Chart?
Visual navigation through the stages of a response process helps you locate specific actions to be taken via Action Mind Maps. Use ConceptDraw DIAGRAM and ConceptDraw MINDMAP for organize the process of response for interactions occurring in social media.
Picture: Create Response Charts
Related Solution:
Processing Flow Chart is a simplified sketch used in chemical and process engineering to illustrate general plant streams, major equipment, and key control loops. ConceptDraw DIAGRAM enhanced with Flowcharts Solution is ideal software for designing ✔️ Processing Flow Charts, ✔️ Process Flow Charts, ✔️ Flow Chart Process Maps
Picture: Processing Flow Chart
Related Solution:
This sample was created in ConceptDraw DIAGRAM diagramming and vector drawing software using the UML Class Diagram library of the Rapid UML Solution from the Software Development area of ConceptDraw Solution Park.
This sample shows the transport protocol mappings for SNMP (Simple Network Management Protocol), the classes of the transport system and relationships between them and is used in IP network.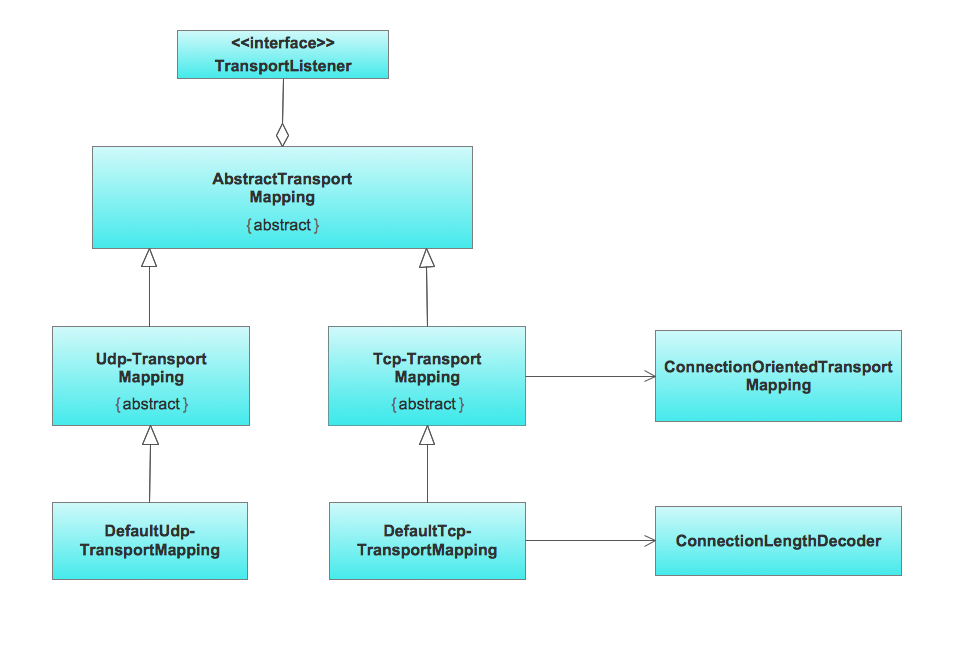
Picture: UML Class Diagram Example for Transport System
Related Solution:
It doesn’t matter what kind of business you have, a bar or a gym, there are common concepts for any of them. One of those concepts is accounting, and to facilitate the work with the figures, you can use accounting flowchart symbols and create a clear and representative scheme. You can create flowchart for auditing, tax accounting and even for planning your own budget.
A graphical tool for displaying successive processes is flowchart. This method is mostly suited to represent an accounting process. The sequence of steps in the accounting process usually consists of standard accounting procedures, that can be depicted by using a minimal number of symbols, applied for the basic flowcharting. The advanced opportunity to create professional Accounting Flow charts is provided by ConceptDraw Accounting Flowcharts solution. It includes contains a library of accounting flowchart symbols used when drawing the accounting process flow.
Picture: Accounting Flowchart Symbols
Related Solution:

