This site uses cookies. By continuing to browse the ConceptDraw site you are agreeing to our Use of Site Cookies.

Network Visualization with ConceptDraw DIAGRAM

ConceptDraw makes the entire process of network visualization easier thanks to the numerous ready-to-use objects included in the package for presentation of network equipment, LDAP directory symbols and many other objects that symbolize resources in most various representations.

Examples of Flowcharts, Org Charts and More

ConceptDraw examples covers a broad spectrum of business graphics categories. We separated all the graphic documents on application areas and had produced multiple solutions for each of them. ConceptDraw provides a wide variety of examples such as flowcharts, organizational charts, business charts, UML diagrams, database and ERD, directional map, network diagrams and lots more. Each solution accommodates 10+ examples that shows specific application cases of a diagram. ConceptDraw STORE is an application for downloading solutions with examples, templates and stencil libraries. Please choose any examples you are interested in, alternatively download them for free; you will need to install ConceptDraw to view them. As you will see, ConceptDraw is very powerful, you can use more than 10000 symbols, examples, and many pre-drawn templates, to create your own spectacular flowcharts, business diagrams, network diagrams and lots more, effortlessly, and in no time at all.
What is ConceptDraw OFFICE
HelpDesk

How to Create a Network Layout Floor Plan

With technology and market forces demanding ever quicker business response times, a well-structured computer network is the foundation of positive communication between employees, and with the wider world. When you walk into most modern work offices, there is a good chance you will be greeted by banks of computer screens and terminals, perhaps some sales points screens or server stacks, almost certainly routers and printers. A side effect of this amount of hardware is the amount of cabling necessary to connect these elements into an effective local area network (LAN). This is the idea behind a network layout plan - it can show how a network is connected, how data transfers between those connections, and give an overview of devices and hardware used in the office. To create a practical computer network floor plan, the network administrator must adhere to the specified requirements and limitations of the office or building in which the LAN will operate - things such as hardware availability,
HelpDesk

What Information to be Displayed in the ConceptDraw PROJECT Gantt Chart View

What information can can contain the project task list? Gantt Chart view is a graphical representation of a project outline that allows one to allocate tasks.You can customize a project’s tasks list view to include the columns you need to meet your information requirements. The columns of the ConceptDraw PROJECT Gantt view contain the information you want to capture about each task in your project. The following article details what information can be contained in the columns of a project outline.
HelpDesk

How To Create a PERT Chart Using PM Easy Solution

Project Evaluation and Review Technique (PERT) is a method of project tasks evaluation and analysis. PERT - is a method of analyzing the tasks required to complete the project. It includes analysis of the time required to complete each task, as well as the determination of the time required to carry out the whole project. PERT was developed to facilitate the planning of huge and complex projects. PERT is used for very large, complex, and non-standard projects. Technology implies the presence of uncertainty, making it possible to develop a schedule of the project without precise information on details and time required for all of its components. The most popular part of PERT is a method of the critical path, based on the construction of the network schedule (PERT network diagram). ConceptDraw Office delivers you the best way to create PERT chart for your project using compatibility between ConceptDraw PROJECT and ConceptDraw DIAGRAM.

ConceptDraw Solution Park ConceptDraw Solution Park

ConceptDraw Solution Park
ConceptDraw Solution Park collects graphic extensions, examples and learning materials
HelpDesk

How to Draw a Matrix Organizational Chart

There are a number of moments which are influenced by how the organizational structure of a certain business needs to be, how complex, and which type it should keep. The matrix organizational structure is atypical because it brings together employees and managers from different departments to work toward accomplishing a goal. This structure is commonly found in businesses that have more than one line of reportage. For instance, a company might contain an engineering department with engineering managers who workers report to. However, these workers might also have to liaise with a different product or project managers depending on current tasks. Some form of matrix organization is found in most large-scale modern businesses. It is one of the most complicated reporting structures. You can easily build a clear matrix organizational chart in ConceptDraw DIAGRAM using templates from ConceptDraw Solution Park.

Business Diagram Software

ConceptDraw business diagram Software is the most powerful business and relational charting software. Create advanced, completely customizable flow charts, organizational charts, business process diagrams, work flow diagrams, audit diagram, value stream maps, TQM diagrams, ERD diagrams, EPC diagrams, marketing diagrams, cause and effect diagrams, dashboards, infographics and other relational business diagrams from your data.
Business Process Modeling
HelpDesk

How to Draw a Pictorial Chart

Pictorial Infographics is used to visually present data comparison. Pictorial charts use relative sizes or repetitions of the same icon, picture, or symbol to show data relation. Using a Pictorial chart to show business data patterns and trends will add much more efficiency to your business communications. Finding the right tool for the job can sometimes be tricky. Developing sophisticated and effective infographics can require tools that may span many different products. Fortunately, ConceptDraw DIAGRAM has everything you need to create polished Pictorial Infographics that beautifully and accurately represent your story, no matter how complex it may be.
HelpDesk

Accounting Information Systems Flowchart Symbols

An accounting Information system is a combination of software and hardware, as well as organizational support. Information system - it is not only the software and computers with network equipment but also a list of instructions and standards which can be notated using Accounting information systems flowchart symbols. All information systems can be divided into information retrieval and data processing systems. The data Flow model is a hierarchical model. Each process can be divided into structural components, that depict by corresponding flowchart symbols, showing the accounting information system in communication with the external environment. The major components of an accounting information systems flowchart are entities, processes, data stores, and data flows. The set of standard accounting information flowchart symbols is intended to show the relationships between the system components. ConceptDraw DIAGRAM can help to draw clear accounting information system diagrams using special flowchart symbols.
HelpDesk

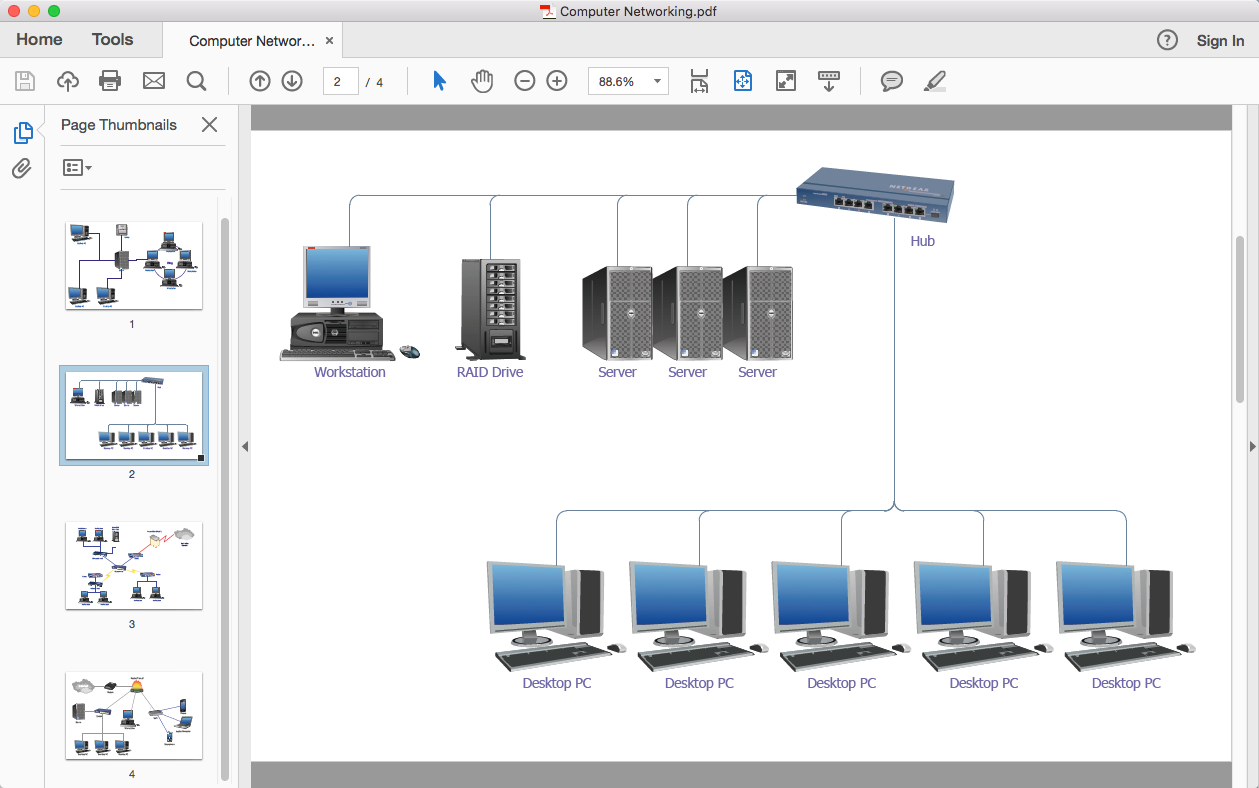
How To Convert a Computer Network Diagram to Adobe PDF

ConceptDraw DIAGRAM allows you to easy transmit your network documentation between different computers with different operating systems and applications using its export capabilities. You can get clear network documentation pack in pdf format and avoid any problems while communicating it with stakeholders.
HelpDesk

How to Create Cisco Network Diagram

The easiest way to design Cisco Network diagram using standard Cisco product symbols is using ConceptDraw DIAGRAM powered by Cisco Network Diagrams solution. The Cisco Network Diagrams solution uses Cisco network symbols to visually document the topology and design of Cisco networks.
HelpDesk

How to Draw a Pie Chart

A pie chart represents data, in a clear and easy to read around (pie) form. A circular pie chart is divided into sections (slice). Each "slice" depicts the It reflects the proportion of each component in the whole "pie". This type of chart is most often used for the visualization of statistical data. That is why pie charts are widely used in marketing. As the pie charts show proportional parts of a whole, they are good for various visual comparisons. For example, it is difficult to imagine a more intuitive way to show segmentation and market share. ConceptDraw DIAGRAM allows you to draw a simple and clear Pie Chart using the Pie Charts solution.
HelpDesk

How to Create a Gantt Chart for Your Project

Instruction on how to create Gantt chart using ConceptDraw PROJECT software.
Gant Chart is a graphical representation of tasks as segments on a time scale. It helps plan or overlapping.
HelpDesk

How to Customize Columns in Your Project Schedule

Some ConceptDraw PROJECT users need to start new projects from their custom default page. In this post, we tell you how to make it.