Venn Diagram Examples for Problem Solving. Venn Diagram as a Truth Table

The PERT chart shows the logical connections and consequence of a set of tasks. PERT charts the time period for problem solving and the implementation plan for all activities along the critical path. The PERT chart is also known as a precedence diagram or project network diagram.
"The Program (or Project) Evaluation and Review Technique, commonly abbreviated PERT, is a statistical tool, used in project management, that is designed to analyze and represent the tasks involved in completing a given project. ...
PERT is a method to analyze the involved tasks in completing a given project, especially the time needed to complete each task, and to identify the minimum time needed to complete the total project.
PERT was developed primarily to simplify the planning and scheduling of large and complex projects. ...
A network diagram can be created by hand or by using diagram software. There are two types of network diagrams, activity on arrow (AOA) and activity on node (AON). Activity on node diagrams are generally easier to create and interpret." [Program Evaluation and Review Technique. Wikipedia]
The PERT chart is one of the Seven Management and Planning Tools (7 MP tools, Seven New Quality Tools).
The PERT chart template for the ConceptDraw PRO diagramming and vector drawing software is included in the solution "Seven Management and Planning Tools" from the Management area of ConceptDraw Solution Park.
PERT chart template

Legend

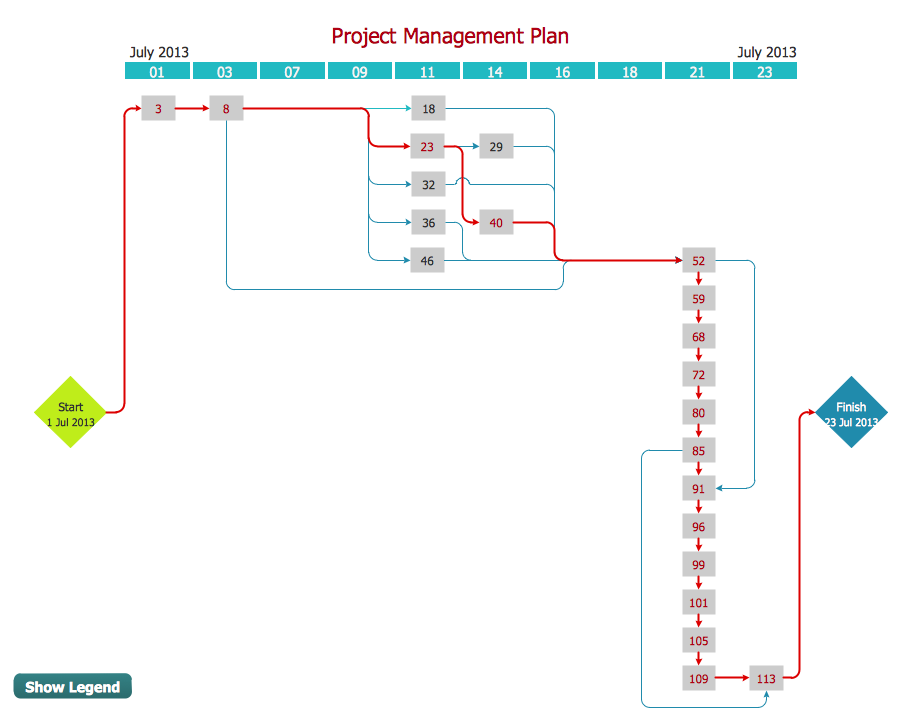
"A project network is a graph (flow chart) depicting the sequence in which a project's terminal elements are to be completed by showing terminal elements and their dependencies.
... the project network shows the "before-after" relations.
The most popular form of project network is activity on node, the other one is activity on arrow.
The condition for a valid project network is that it doesn't contain any circular references." [Project network. Wikipedia]
The PERT chart example "Project management plan" was created using the ConceptDraw PRO diagramming and vector drawing software extended with the solution "Seven Management and Planning Tools" from the Management area of ConceptDraw Solution Park.
PERT

Legend

PERT Chart
Venn Diagram Examples for Problem Solving

PDPC

How To Create Onion Diagram

Affinity Diagram

Total Quality Management Business Diagram

Venn Diagram Examples for Problem Solving. Environmental Social Science. Human Sustainability Confluence

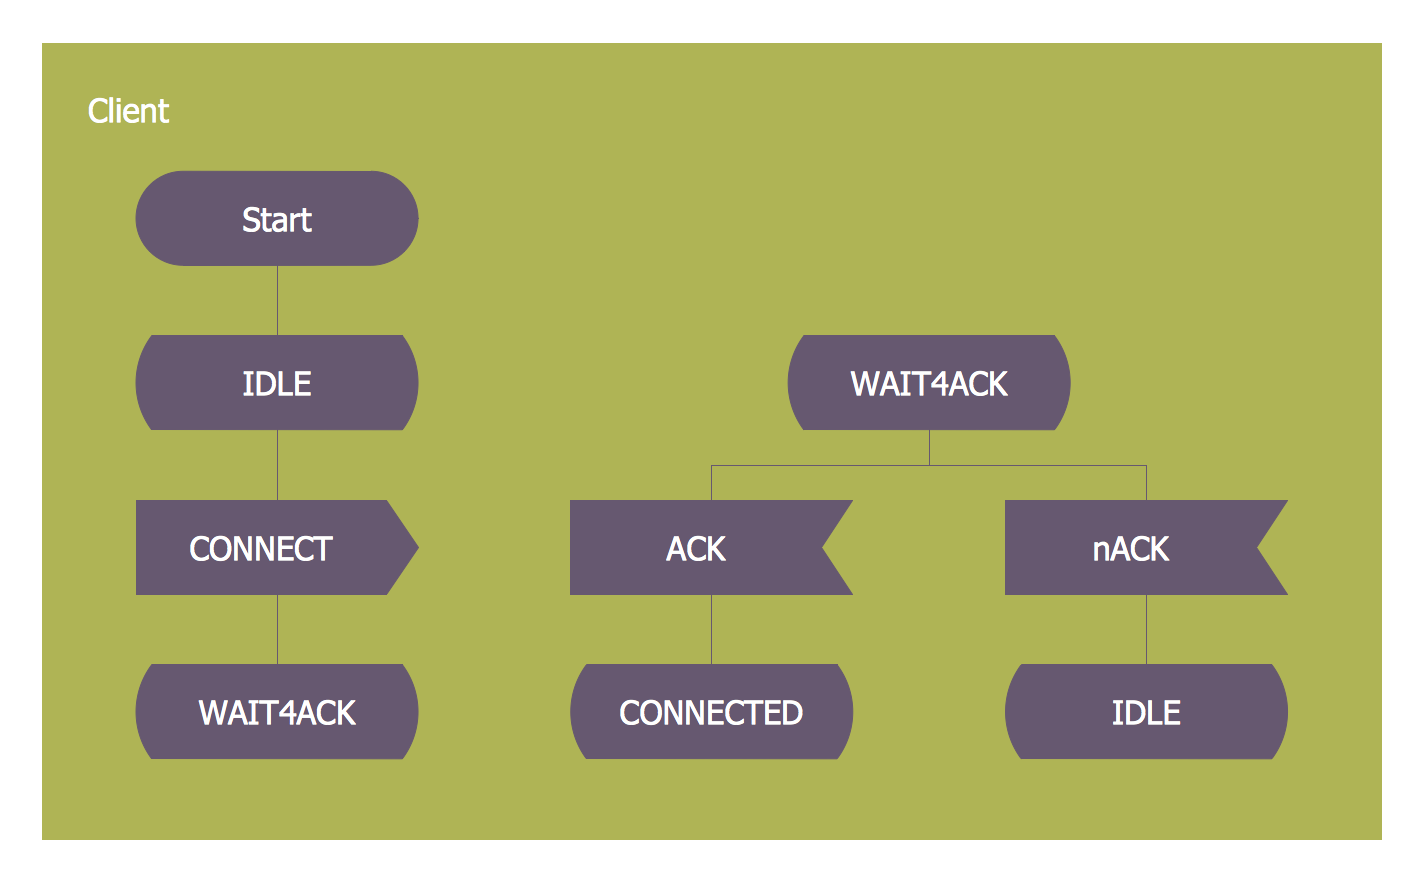
SDL — Systems Engineering
Flowcharting Software

Prioritization Matrix

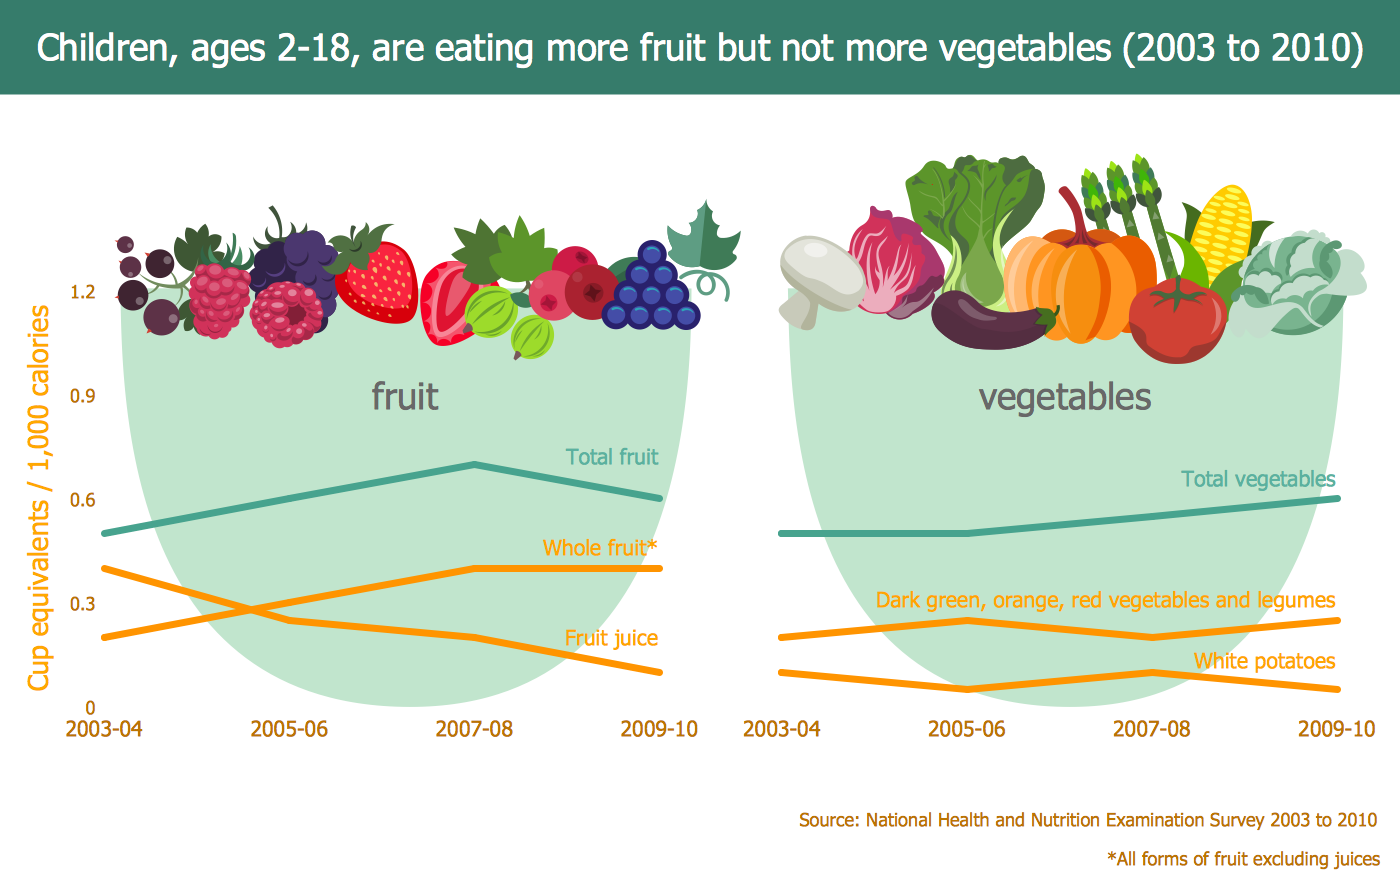
Food Art
Flowchart Symbols Accounting. Activity-based costing (ABC) flowchart

- Pert Chart Wiki
- Activity on Node Network Diagramming Tool | PERT chart ...
- Gantt Chart Wiki
- Mind Map Affinity Diagram Wiki
- PERT chart - Project management plan | PERT chart - Template ...
- PERT chart - Project management plan | Program Evaluation and ...
- Precedence Diagram Software
- Activity Network ( PERT ) Chart | Examples of Flowcharts, Org Charts ...
- Pert Chart Project Examples
- Fishbone Diagram Wiki
- Root cause analysis tree diagram - Sale problem solution | Root ...
- PERT chart - Project management plan | PERT Chart Software ...
- Wikipedia Data Flow Diagrams With Seating Arrangement
- SWOT Matrix | SWOT analysis matrix diagram templates | SWOT ...
- Wikipedia Parts Of Activity Diagram
- Pyramid Chart Examples | Ansoff Matrix | Prioritization Matrix | Matrix ...
- UML Diagram | Design Elements for UML Diagrams | PERT Chart ...
- Project management triangle diagram | Bar Diagrams for Problem ...
- Process Flowchart | Activity Network ( PERT ) Chart | Basic Flowchart ...