Pyramid Chart Examples

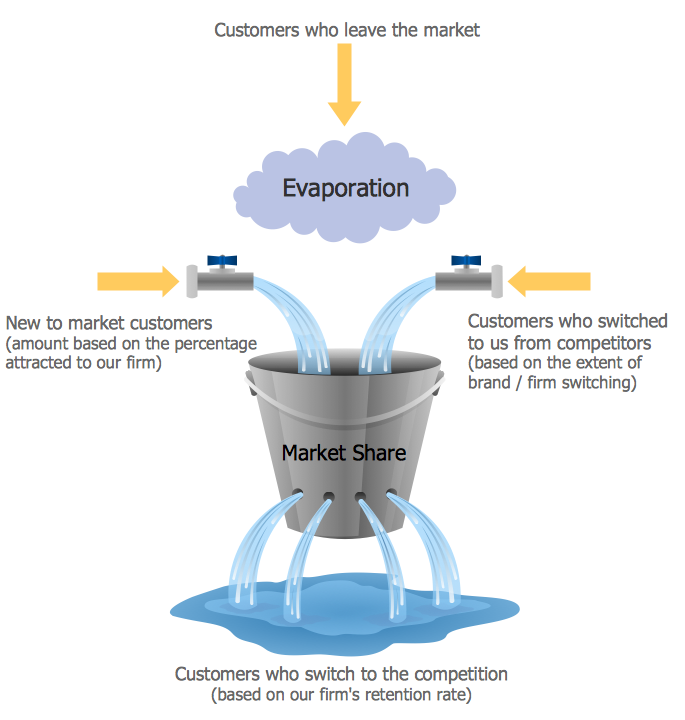
Marketing Analysis Diagram

Pyramid Charts

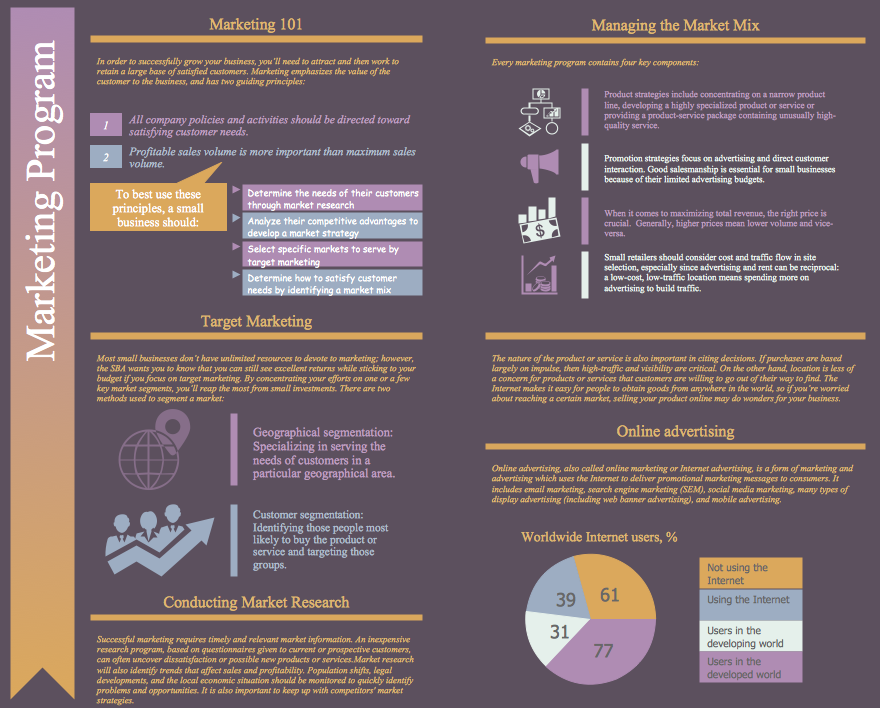
Marketing Plan Infographic
Market Chart
Pyramid Diagram and Pyramid Chart

 ConceptDraw Solution Park
ConceptDraw Solution Park collects graphic extensions, examples and learning materials
Gant Chart in Project Management


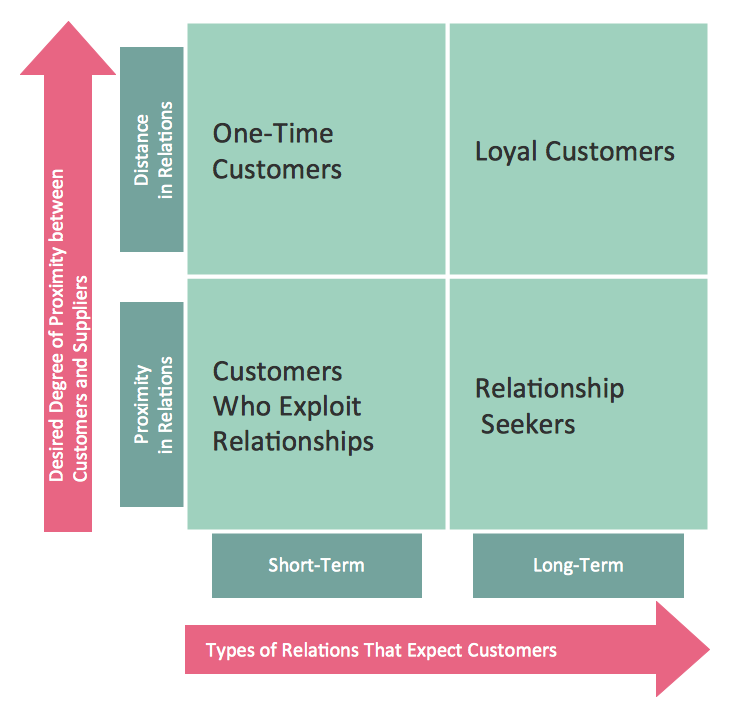
Six Markets Model Chart

 Matrices
This solution extends ConceptDraw DIAGRAM software with samples, templates and library of design elements for drawing the business matrix diagrams.
Business Tools Perceptual Mapping

 Marketing
This solution extends ConceptDraw DIAGRAM and ConceptDraw MINDMAP with Marketing Diagrams and Mind Maps (brainstorming, preparing and holding meetings and presentations, sales calls).
Target Diagram

Matrices
 Target and Circular Diagrams
This solution extends ConceptDraw DIAGRAM software with samples, templates and library of design elements for drawing the Target and Circular Diagrams.
SWOT Analysis Solution - Strategy Tools

SWOT Sample in Computers

HelpDesk
How to Make an Ansoff Matrix Template

- Pyramid Chart Examples | Marketing Analysis Diagram | Marketing ...
- Marketing plan - Circular diagram | Pyramid Chart Examples | HVAC ...
- Pyramid Chart Examples | Marketing plan - Circular diagram ...
- Marketing Flow Chart | Marketing Organization Chart | Flowchart ...
- Gant Chart in Project Management | Marketing | Marketing Analysis ...
- Feature Comparison Chart Software | Market Chart | Deployment ...
- Marketing | ConceptDraw Solution Park | Pyramid Chart Examples ...
- Marketing Plan Infographic | HVAC Marketing Plan | Marketing plan ...
- Pyramid Diagrams | Pyramid Diagram | Pyramid Chart Examples ...
- Marketing Strategy Block Diagram
- Marketing Diagrams | Flowchart Marketing Process. Flowchart ...
- Marketing Analysis Diagram | Flowchart Example : Flow Chart of ...
- Marketing Charts | Design elements - Marketing charts | Market ...
- Feature Comparison Chart Software | Competitive feature ...
- Flowchart Marketing Process. Flowchart Examples | Sales Process ...
- Flowchart Marketing Process. Flowchart Examples | Flowchart ...
- Sample Of Marketing Sales Chart
- Pyramid Chart Examples
- Marketing Plan Infographic | Pyramid Charts | Marketing Charts ...
- Marketing Diagrams | Marketing Charts | Marketing Organization ...