HelpDesk
How to Make a UML Diagram in ConceptDraw PRO
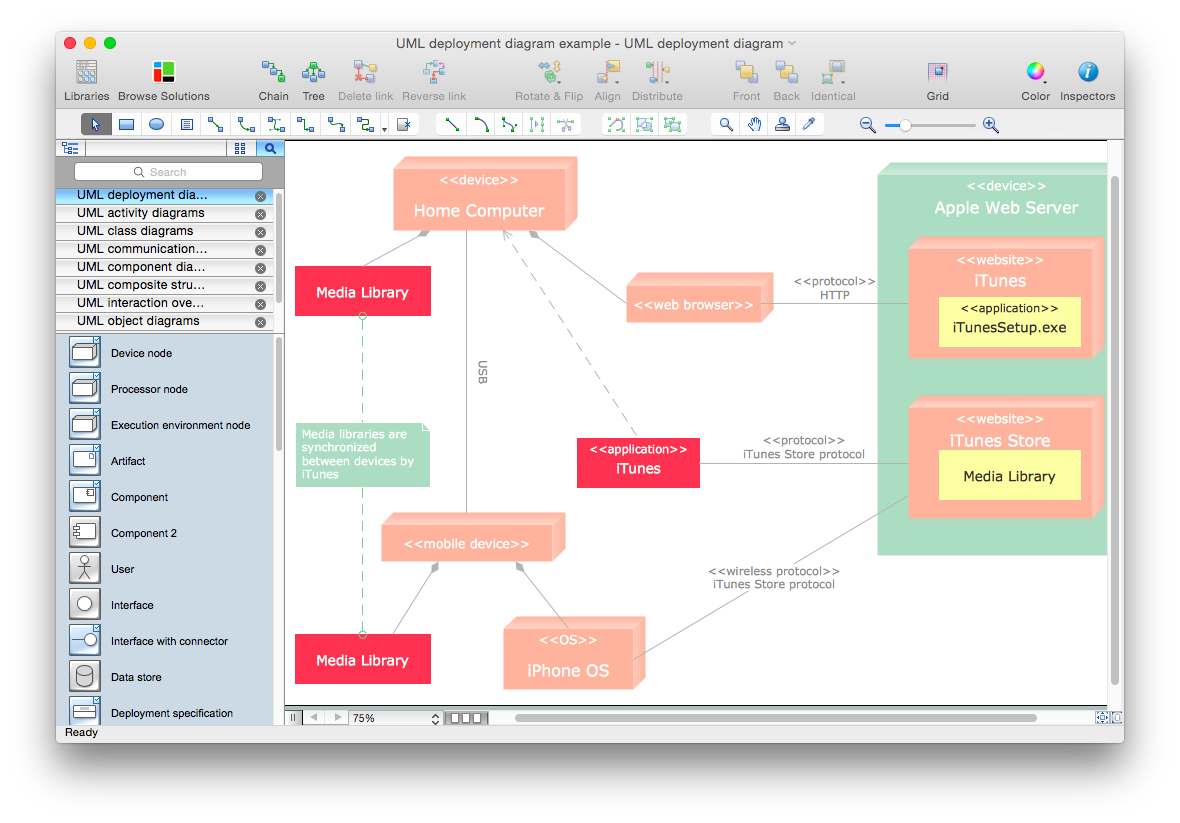
The Unified Modeling Language™(UML) is a standard visual modeling language to document business processes and software architecture. UML uses several types of diagrams including Use Case Diagrams, Class, Package, Component, Composite Structure Diagrams, Deployments, Activities and Interactions. The accepted standard used when modeling a system is known as Unified Modeling Language (UML), a generic set of notations that are used when creating UML diagrams. These notations can visually represent requirements, subsystems, logical and physical elements, and structural and behavioral patterns, that are especially relevant to systems built using an object-oriented style.Using UML during the modeling process has a number of benefits — for one, the entire development team can share information and collaborate using common language, diagrams and software, something that's not possible when using a more task-specific programming language.
It allows team members to create system 'blueprin

HelpDesk
How to Make a Workflow Diagram Using ConceptDraw PRO
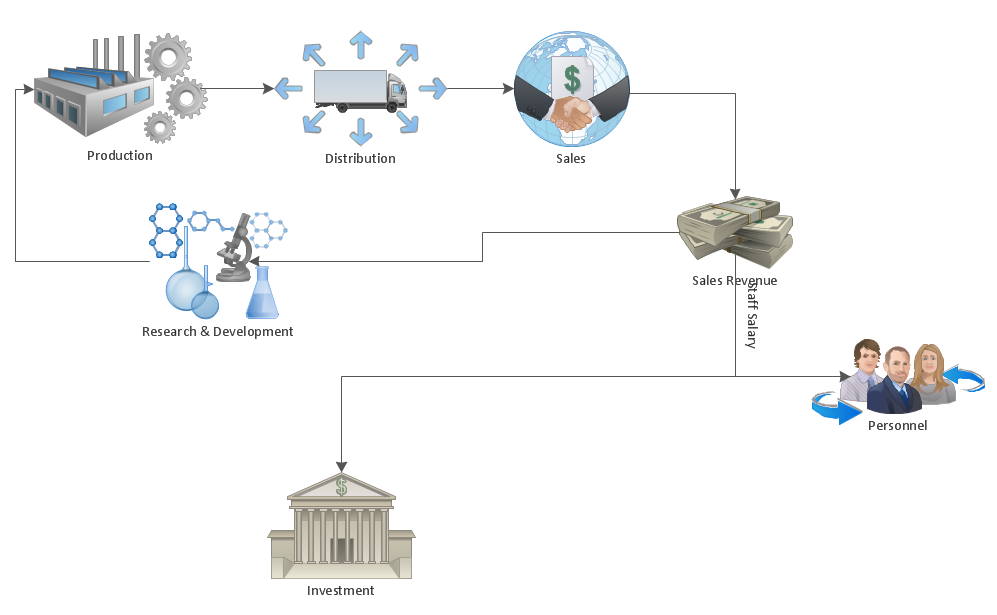
With the help of a workflow diagram you can visually describe the tasks, documents, people responsible for execution at each stage of workflow. Modern workflow diagrams have a specific focus on quality control. This can apply to the quality of inputs and outputs related to a process, or to the actual efficiency of the workflow itself. Different sectors of business use different diagramming techniques, and this has given rise to a number of methods that have become recognized in their own right as industry standards. ConceptDraw PRO, with the Workflow Diagrams solution, is ideal for creating diagrams of this type. Its RapidDraw technology takes the strain from diagram arrangement, allowing users to create their process steps with a single click, ideal for generating the many repeatable tasks that can make up a workflow. The Workflow Diagrams solution complements this feature with a library of selected icons to represent various steps.HelpDesk
How to Make Soccer Position Diagram Using ConceptDraw PRO
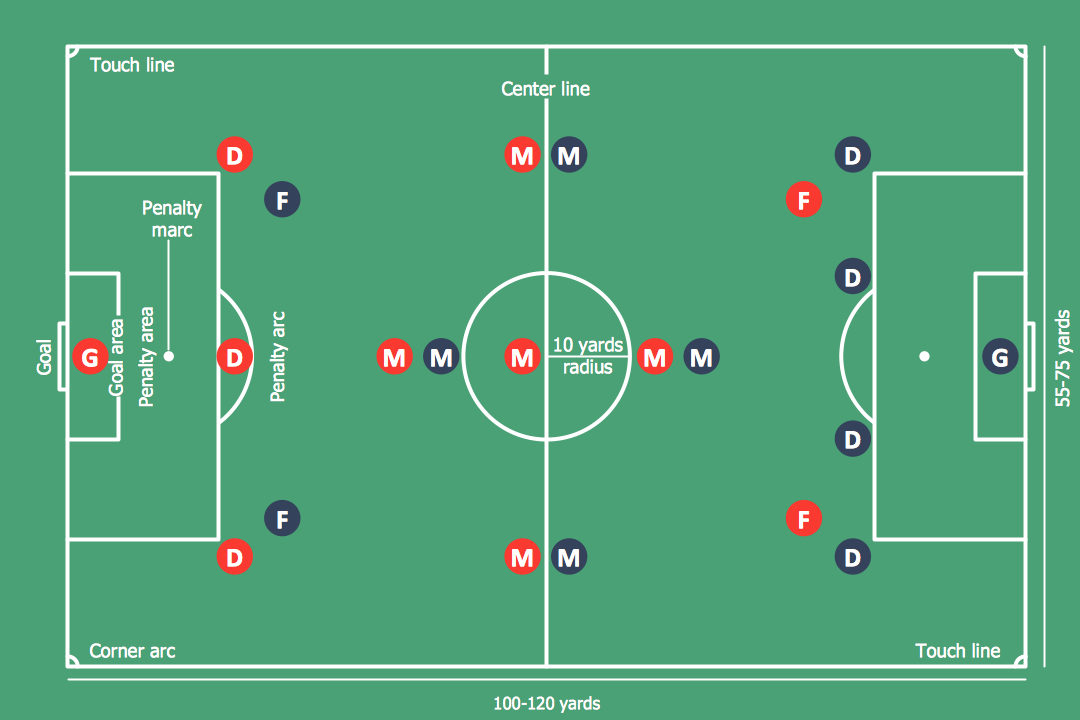
The soccer field has the form of a large rectangle, covered with grass. Dimensions of soccer fields may vary slightly, depending on the level of the game, but all fields have some common characteristics. Soccer players may take different positions. Each soccer position has its own name, and implies certain player functions. Every soccer position has a very specific name and task: Goalkeeper, Defenders, Midfielders and Forwards. During preparation for the game coach met a challenge: how to explain each player's position and his role in the game. The difficulty is the fact that in the course of the game players will often move on the field and do not stay in one place. Football field diagram with dimensions and marking, and positions - it is an important tool for the coach. ConceptDraw PRO helps both coach and players to understand exactly their roles during the particular game. The ability to create Soccer diagrams is contained in the ConceptDraw Soccer solution. The solution providesHelpDesk
How to Draw a Circular Arrows Diagram Using ConceptDraw PRO
The cyclic recurrence is a fundamental property of multiple systems. The cycle is a process which consists from elements (phases, stages, stages) following each other. Many processes in astronomy, biology, chemistry, physics, mathematics, etc. have a cycle properties. It is also widely used in information technologies and marketing analysis. Graphical representation of cyclic processes can have many forms. It can be a circle, parabola, hyperbola, ellipse and others. A Circular Arrows Diagram is used as one of the statistical charts in the business, mass media and marketing. ConceptDraw PRO provides its users tools for making easy drawing Circular Arrows Diagrams.HelpDesk
How to Make an Ansoff Matrix Template in ConceptDraw PRO
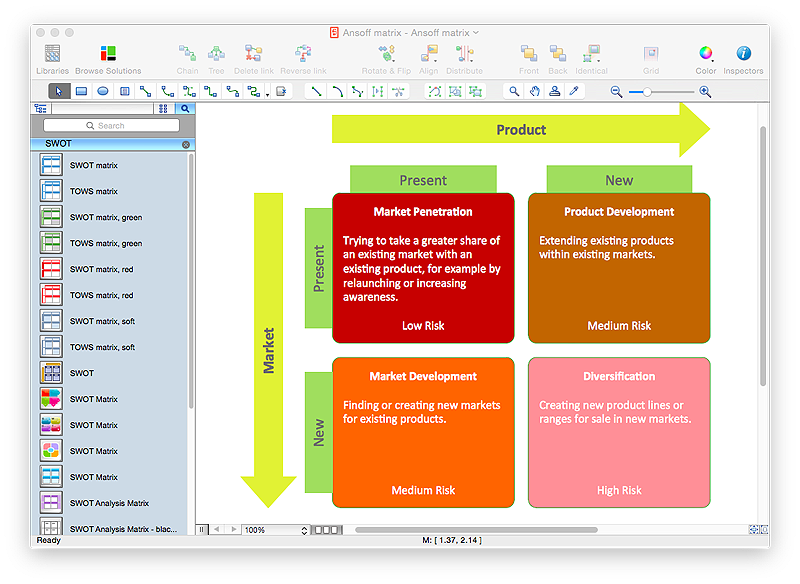
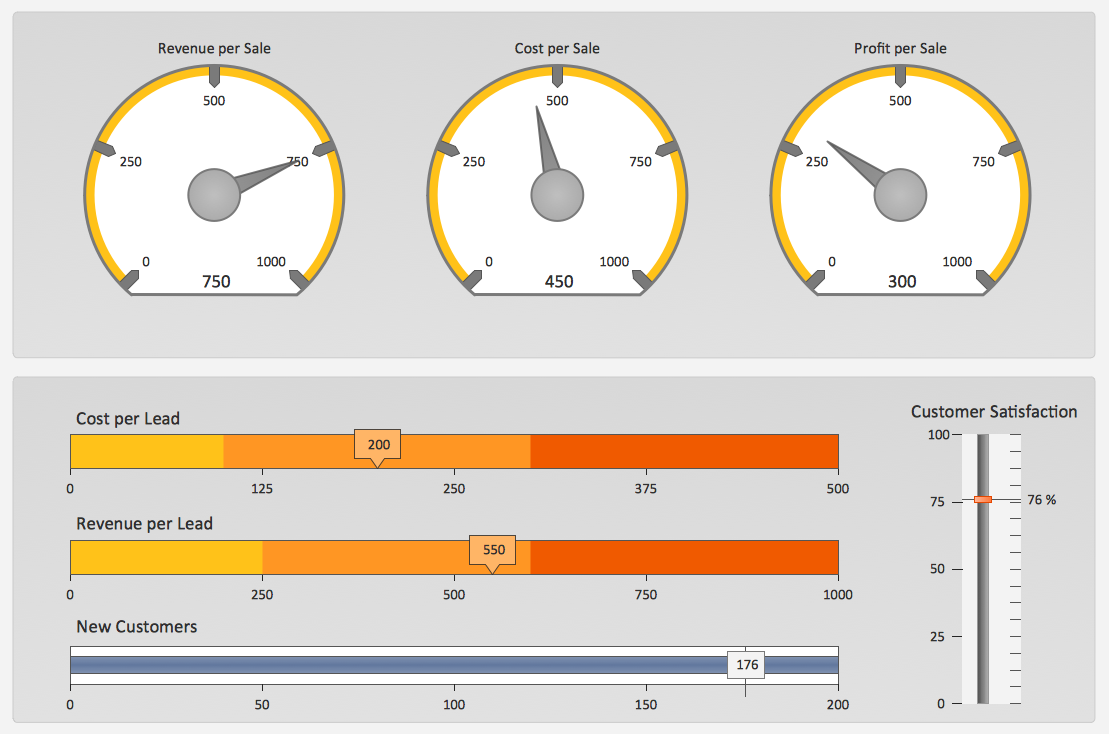
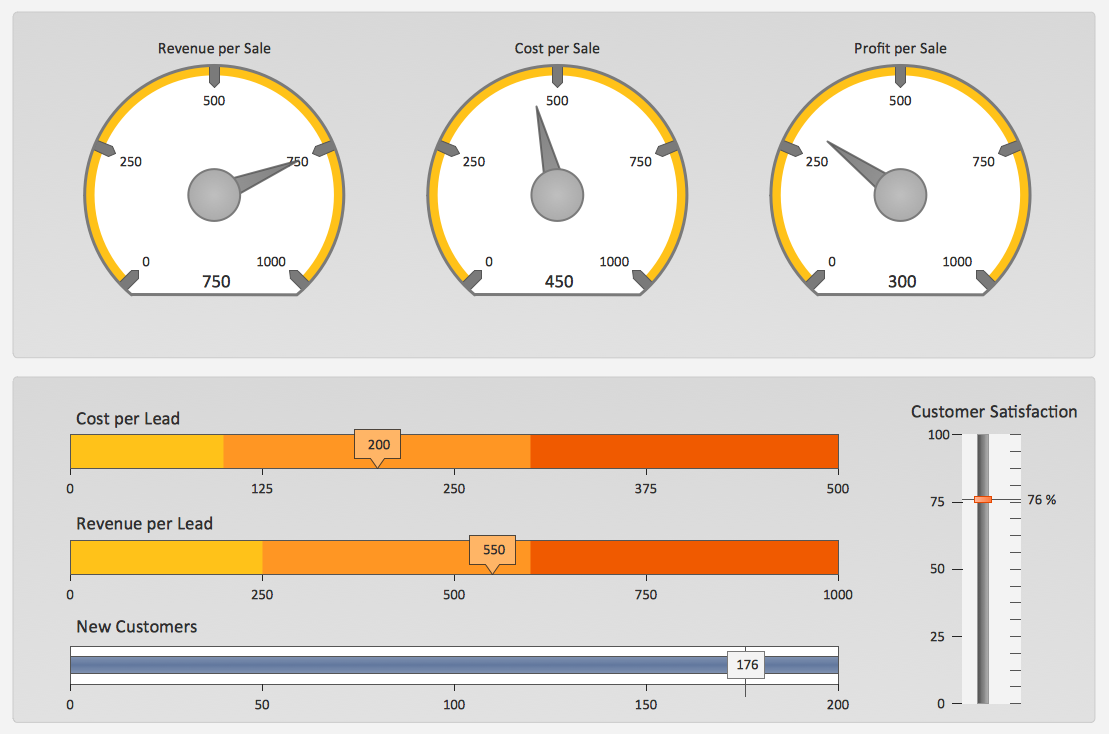
Ansoff Matrix is a business strategic management tool that helps a business determine its product and market growth strategy. Ansoff matrix has four sections to show each impacting ways that businesses can grow. Using Ansoff Matrix enables determining the current position of any business in the industry and choose the direction of its growth, which would provide the most competitive position. While Ansoff Matrix is most commonly used as a business planning tool it can be used also for personal development. You can make Ansoff Matrix template for your organization using ConceptDraw PRO Matrices solution.A KPI Dashboard
Composing a dashboard from different KPI is a kind of art. Visualizing sales data you have to keep balance to keep your dashboard informative, not messy. ConceptDraw Sales Dashboard solution gives you a set of good examples of balanced dashboards.HelpDesk
How to Draw an Organizational Chart Using ConceptDraw PRO
The organizational chart software is a valuable tool for modern business. It is important for any business to build a clear organizational structure that determines the responsibilities and relationships between different positions in the organization. The clear structured organization - means the clear structured business workflow, which is the core of success in the business. ConceptDraw PRO is an org chart software that allows you to draw an organizational structure of your company quickly and easily.Sales KPI Dashboards
A combination of sales KPI on a one dashboard helps you track sales activities and results. Visualizing sales data using ConceptDraw PRO software extended with the Sales Dashboard solutiongives you flexibility in choosing and tuning KPIs.HelpDesk
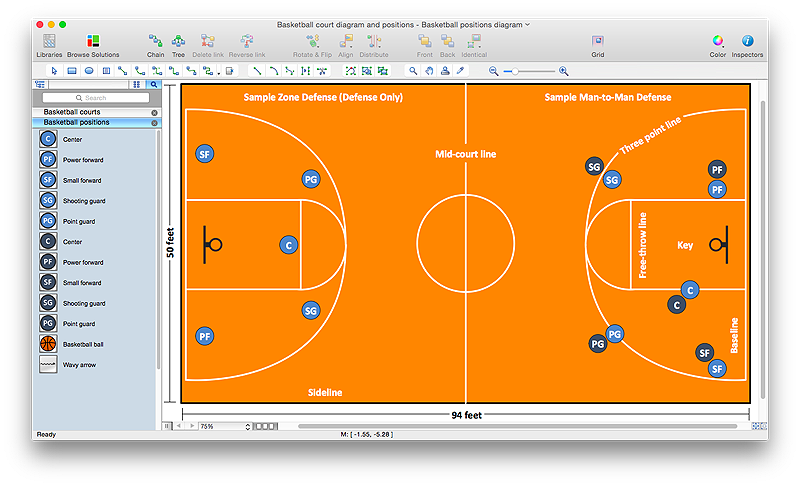
How to Make a Basketball Court Diagram
Basketball Court diagrams is often used as a teaching and learning tool for coaches, players and parents to describe the basketball moves and shooting drills. The ability to create Basketball diagrams with ConceptDraw PRO is contained in the Basketball solution. It provides a set of special tools for creating different Basketball diagrams. Basketball court diagram is used to describe basketball moves and shooting drills during the discussion of the match, as well as to develop a winning defense and attack strategy as a clear visual plans for future games.HelpDesk
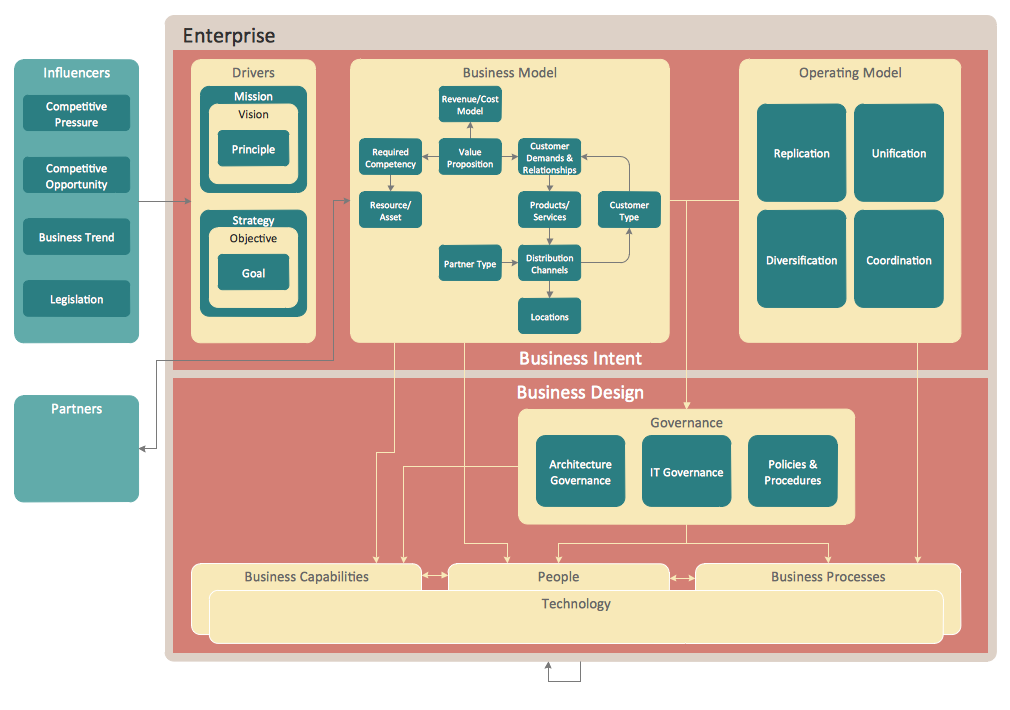
How to Create an Enterprise Architecture Diagram in ConceptDraw PRO
An Enterprise Architecture (EA) diagram is used to display the structure and operations of an organization.It is used to analyze and document an organization and its business functions, along with the applications and systems on which they are implemented. The aim of an enterprise architecture diagram is to determine how an organization can effectively achieve its current and future objectives. The Enterprise Architecture often uses diagrams to support the decision-making process. ConceptDraw PRO allows you to design Enterprise Architecture diagrams of any complexity.A KPI Dashboard Provides the Answers Your Sales Team
Sales dashboard is a tool that provides the answers to all questions your sales team may have. A mature sales dashboard provides complete set of KPI to shows corporate, team or personal performance to keep sales process clear.HelpDesk
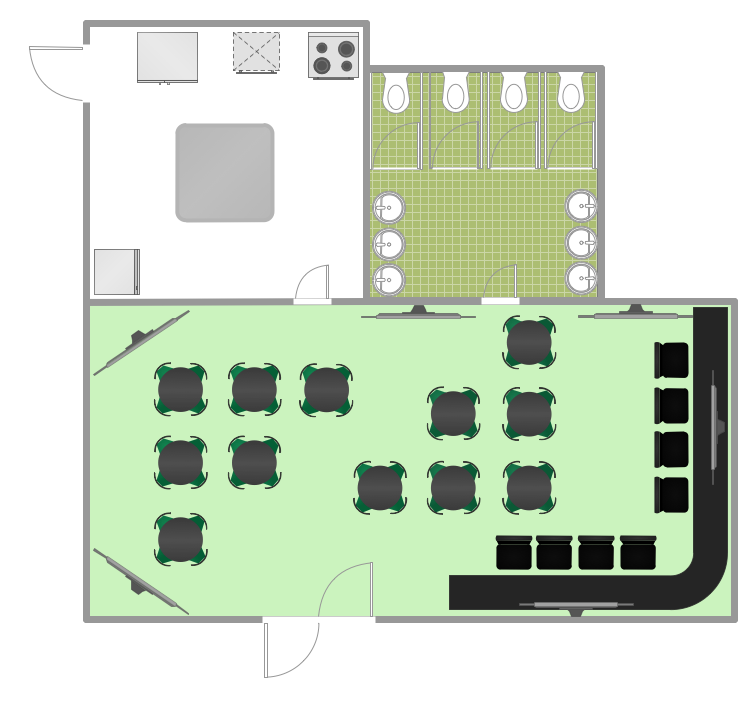
How to Design a Restaurant Floor Plan
Someone might think that creating a plan of cafe or restaurant is quite simple. But in fact it is a real art. You need to make it not only beautiful, but also convenient for visitors. Today, restaurants and cafes are not only the places, where people eat, but a places for business meetings, and recreation. Therefore, a well-designed project of the restaurant (cafe, bar) leads to successful sales and good incomes. The ConceptDraw Cafe and Restaurant Floor Plan solution includes libraries that are tailored for Cafe and Restaurants floor plans and interiors.HelpDesk
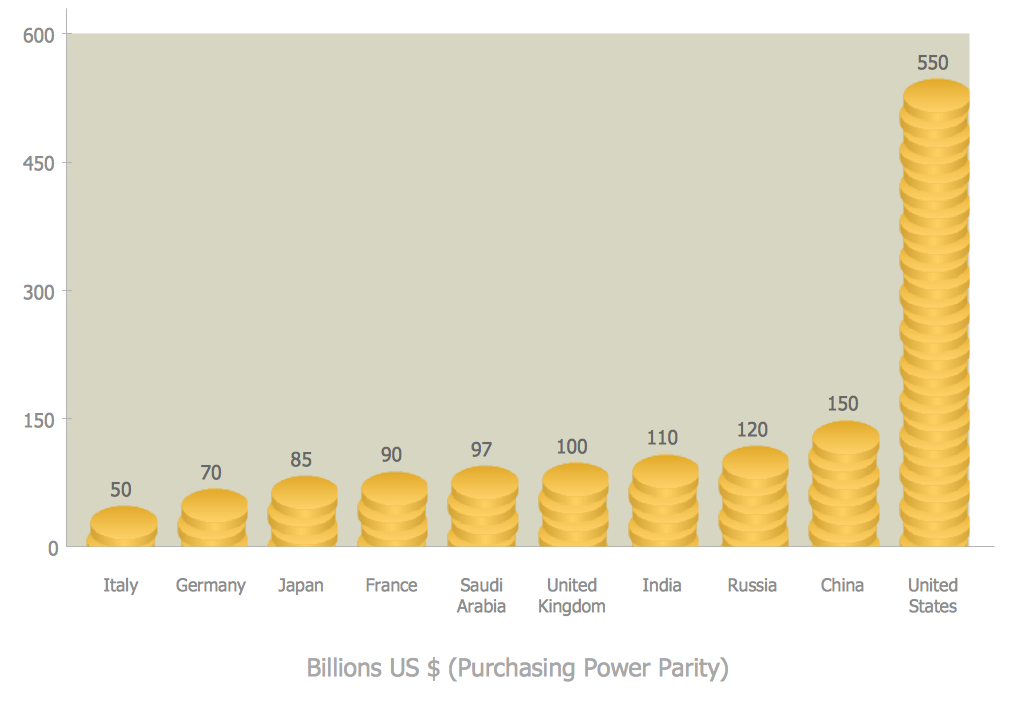
How to Create a Picture Graph in ConceptDraw PRO
Picture Graphs are used commonly to represent non-complex data to a large audience. A Picture Graph is simple kind of marketing diagram used to show the relationship among various quantities. It include pictures or symbols to represent information visually. There are many cases when you have just some numbers to show and compare. This is not a reason to not use visual tools. You can produce a simple picture graph using memorable symbols to get the best visual presentation. Using specific symbols instead of regular colored bars makes picture graphs a much more descriptive tool. You can use tools from an existing library or find appropriate clipart in ConceptDraw’s collection. ConceptDraw PRO allows you to draw a simple and easy to understand Graph Charts using the special library.HelpDesk
How to Create SWOT Analysis Template Using ConceptDraw PRO
SWOT-analysis is used to develop a marketing strategy. SWOT-analysis includes determining the strengths and weaknesses in the company's activity, potential external threats and opportunities and assesses their relative strategic competitors. ConceptDraw SWOT and TOWS Matrix Diagrams solution provide a set of SWOT matrix in which should be recorded and then compared the strengths and weaknesses of the enterprise and the market opportunities and threats. This comparison allows you to determine what steps can be taken for the development of your company and what problems need to be addressed urgently.HelpDesk
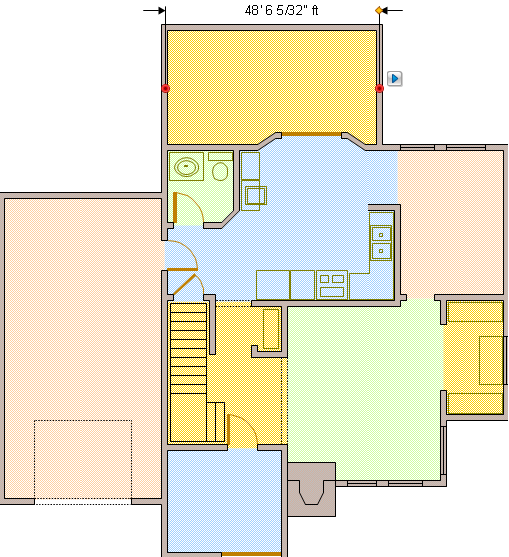
How to Create a Building Plan Using ConceptDraw PRO
Making a home or apartment floor plans involves many different elements that can be managed using ConceptDraw PRO. The ability to design different floor plans is delivered by the Floor Plans solution. Using this solution you can easily create and communicate floor plans of any complexity.HelpDesk
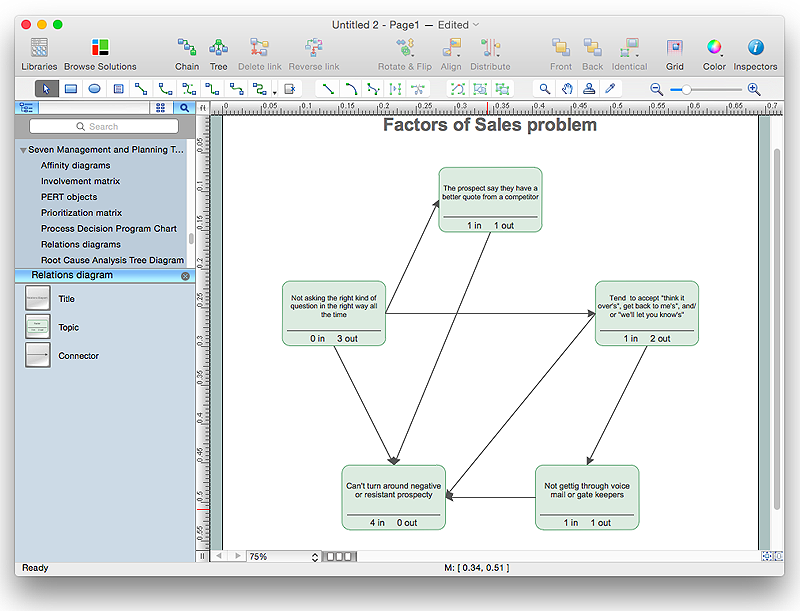
How To Create the Interaction (Relation) Diagram
Identify relationships between factors affecting a problem using interaction (relation) diagram. The ability to create a Relation diagram from a mind map is supported by the ConceptDraw Seven Management and Planning Tools solution.HelpDesk
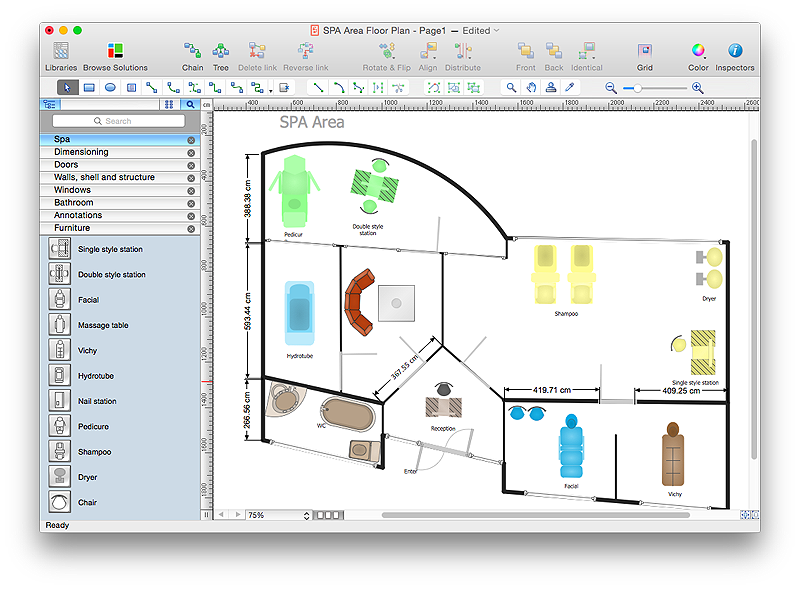
How to Draw a Floor Plan for SPA in ConceptDraw PRO
The key to a successful spa is a well designed floor plan. It should seamlessly combine both comfort and functionality. ConceptDraw PRO allows you to draw the floor Plan for your SPA or salon design using a special equipment library as well as set of special objects that displays the sizes, corners, squares and other floor plan details. You can use ConceptDraw PRO to make the SPA and Gym plans simple, accurate and easy-to-read. ConceptDraw PRO allows you to draw the floor Plan for your SPA or salon design using a special equipment library as well as set of special objects that displays the sizes, corners, squares and other floor plan details.HelpDesk
How to Create a Fishbone (Ishikawa) Diagram Quickly
A Fishbone (Ishikawa) diagram is also called cause-and-effect diagram. Fishbone diagram is often used in business to determine the cause of some problem. The diagram illustrates the main causes and sub-causes leading to an event. The main goal of the Fishbone diagram is to illustrate in a graphical way the relationship between a given outcome and all the factors that influence this outcome. The complete diagram resembles a fish skeleton as its name implies. The ability to create a Fishbone Diagram is supported by the Fishbone Diagram solution. Use ConceptDraw MINDMAP for structuring data and then ConceptDraw PRO for generating a Fishbone Diagram from mind map structure.HelpDesk
How to Manage Problem Solving Using Seven Management and Planning Tools
Stage by stage gouide on using visual tools to move toward solving the problem.
- TQM Diagram Tool | Marketing Diagrams | Sales KPI Dashboards |
- Business diagrams & Org Charts with ConceptDraw PRO | A KPI ...
- Fishbone Diagram | Sales KPI Dashboards | Management |
- TQM Diagram Tool | Marketing | Sales KPI Dashboards |
- Fishbone Diagram | Sales KPI Dashboards | ConceptDraw Solution ...
- Fishbone Diagram | Sales KPI Dashboards | Marketing |
- Fishbone Diagram | Marketing | Sales KPI Dashboards |
- Fishbone Diagram | Business Productivity Diagramming | Sales KPI ...
- A KPI Dashboard Provides the Answers Your Sales Team | How To ...
- A KPI Dashboard Provides the Answers Your Sales Team | Visualize ...
- Sales KPI Dashboards | Export from ConceptDraw PRO Document ...
- Block diagram - Sources of customer satisfaction | Marketing ...
- Total Quality Management TQM Diagrams | Meter Dashboard ...
- A KPI Dashboard | Constant improvement of key performance ...
- Business diagrams & Org Charts with ConceptDraw PRO ...
- A KPI Dashboard Provides the Answers Your Sales Team | Website ...
- Sales Dashboard | Total Quality Management TQM Diagrams ...
- Sales KPI Dashboards | A KPI Dashboard | KPIs and Metrics |
- Marketing and Sales Organization chart. Organization chart Example
- A KPI Dashboard Provides the Answers Your Sales Team | Export ...
