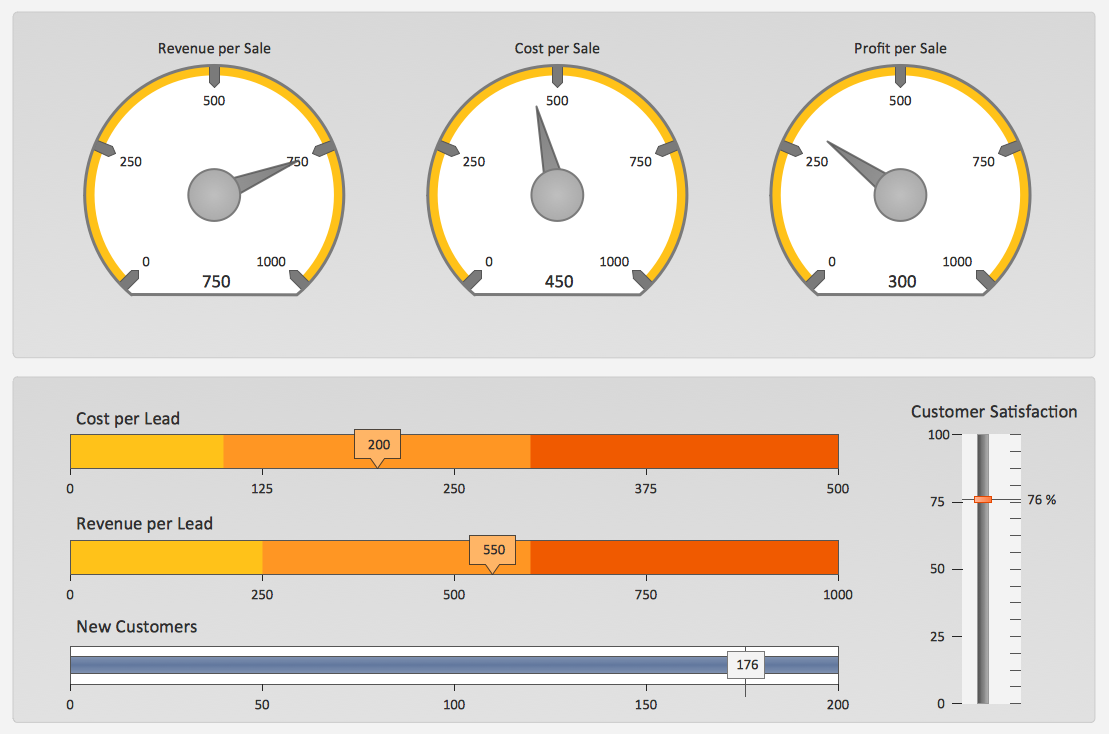
Sales KPI Dashboards
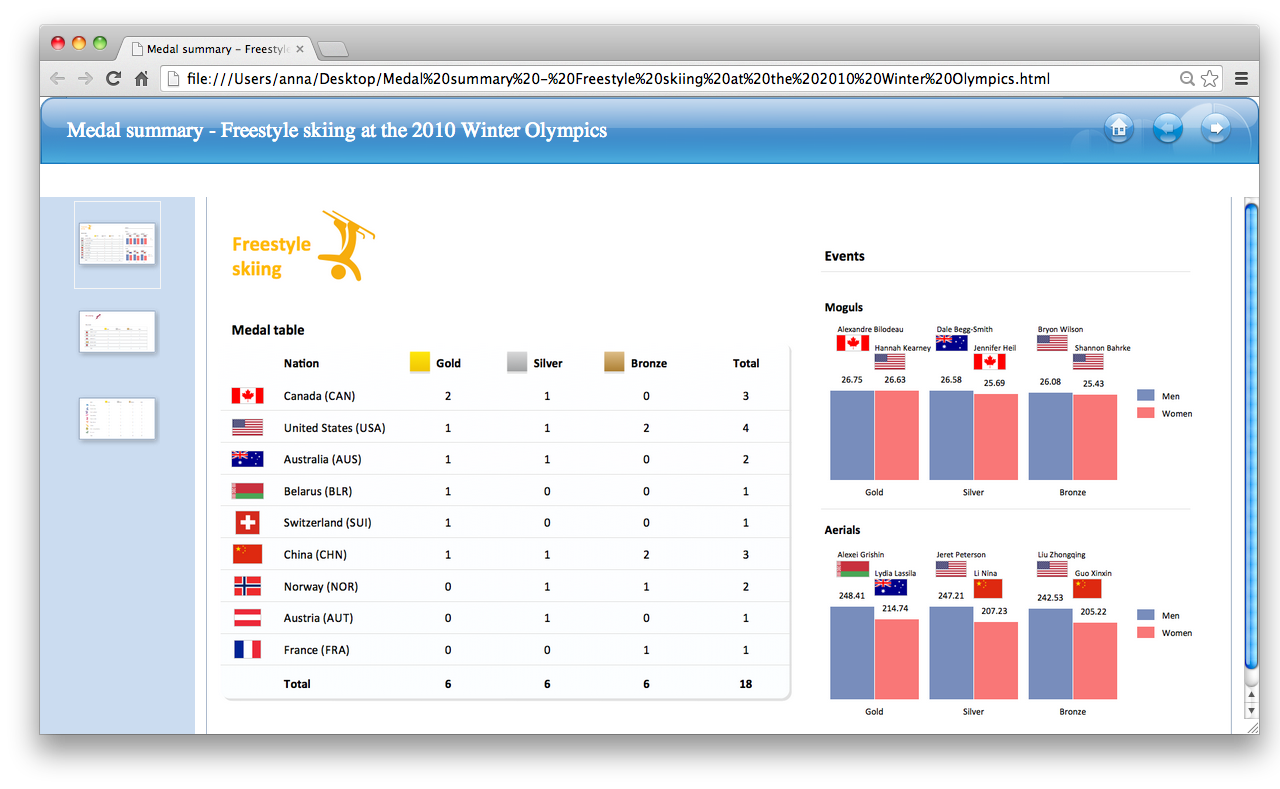
Export from ConceptDraw DIAGRAM Document to HTML

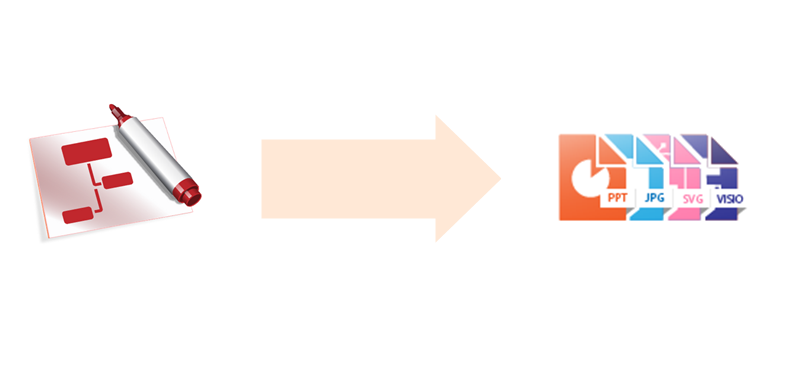
Export from ConceptDraw DIAGRAM Document to a Graphic File

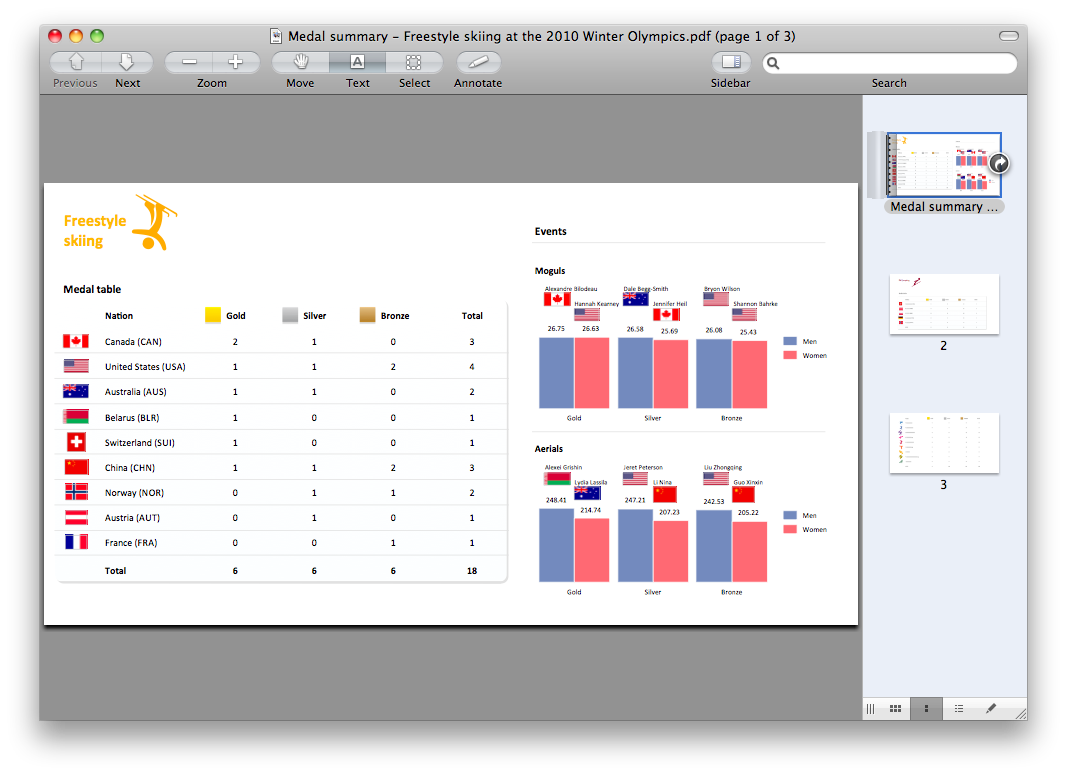
Export from ConceptDraw DIAGRAM Document to PDF (Adobe Acrobat®) File
Export from ConceptDraw DIAGRAM Document to MS Visio® XML

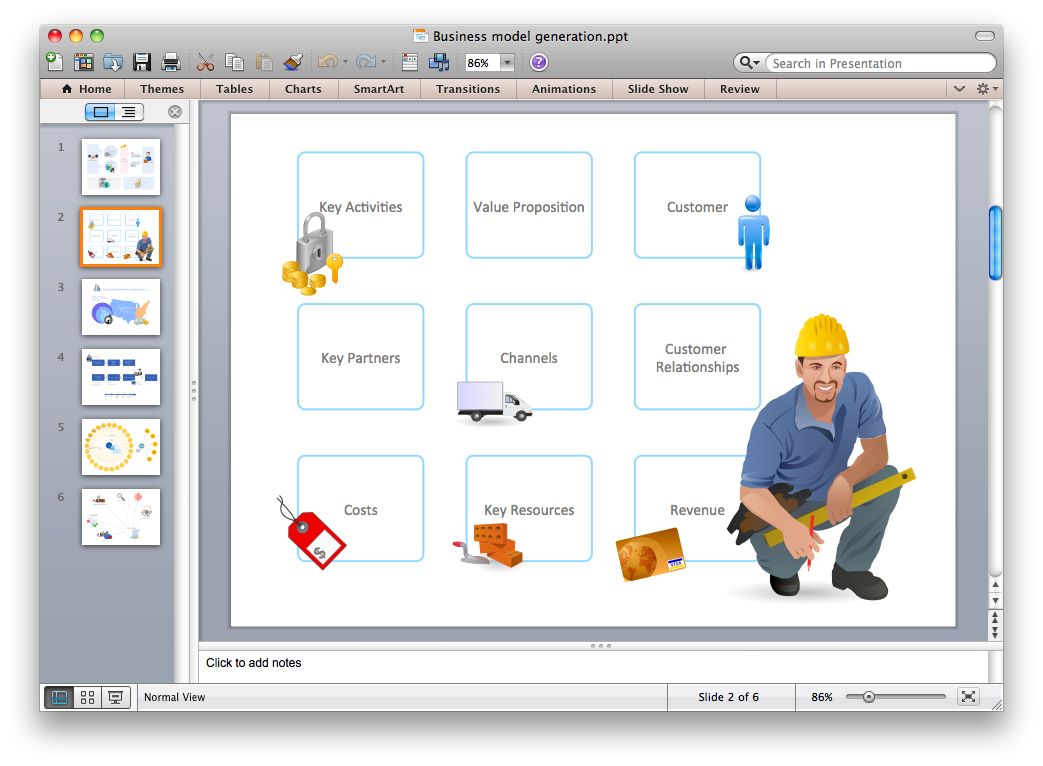
Export from ConceptDraw DIAGRAM Document to PPT or PPTX (MS PowerPoint®) File
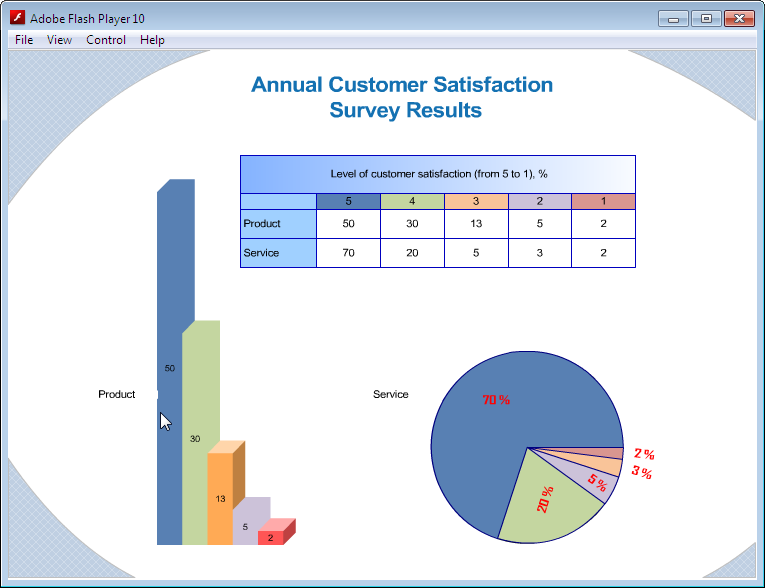
Export from ConceptDraw DIAGRAM Document to SWF (Adobe® Flash®) File
ConceptDraw DIAGRAM Export Capabilities
 Business Productivity Area
Business Productivity Solutions extend ConceptDraw products with tools for making presentations, conducting meetings, preparing documents, brainstorming, or building new strategies.
 PM Dashboards
The PM Dashboards solution extends the management boundaries of ConceptDraw DIAGRAM and ConceptDraw PROJECT products with an ability to demonstrate changes to the budget status, to show the project progress toward its objectives, to display clearly the identified key performance indicator (KPI) or the set of key performance indicators for any project. This solution provides you with examples and ability to generate three types of visual dashboards reports based on your project data Project Dashboard, Tactical Dashboard, and Radar Chart. By dynamically charting the project’s key performance indicators that are collected on one ConceptDraw DIAGRAM document page, all project participants, project managers, team members, team leaders, stakeholders, and the entire organizations, for which this solution is intended, have access to the daily status of projects they are involved in.
Business Diagram Software


 ConceptDraw Solution Park
ConceptDraw Solution Park collects graphic extensions, examples and learning materials
 Project Management Area
Project Management area provides Toolbox solutions to support solving issues related to planning, tracking, milestones, events, resource usage, and other typical project management functions.
- Fishbone Diagram | Marketing | Sales KPI Dashboards |
- Fishbone Diagram | Sales KPI Dashboards | Marketing |
- Fishbone Diagram | Sales KPI Dashboards | Management |
- Entity-Relationship Diagram (ERD) | Marketing | Fishbone Diagram |
- Fishbone Diagram | Marketing | Sales Dashboard | - Conceptdraw.com
- Fishbone Diagram | Business Productivity Diagramming | Using ...
- TQM Diagram Tool | Marketing Diagrams | Sales KPI Dashboards |
- TQM Diagram Tool | Marketing | Sales KPI Dashboards |
- Seven Management and Planning Tools | Entity-Relationship ...
- Fishbone Diagram | Business Productivity Diagramming | Cisco ...
- Fishbone Diagram | Using Fishbone Diagrams for Problem Solving ...
- Relations diagram - Sales process | Marketing | Seven Management ...
- Fishbone Diagram | Crow's foot ERD - Educational data base ...
- Sales KPI Dashboards | A KPI Dashboard Provides the Answers ...
- Sales Dashboard Template | Europe spatial dashboard template ...
- A KPI Dashboard Provides the Answers Your Sales Team
- Fishbone Diagram | Sales Dashboard | Audio and Video Connectors |
- Sales KPI Dashboards
- Relations diagram - Sales process | Business Process Diagram ...
- Entity-Relationship Diagram (ERD) | Sales Dashboard | Martin ERD ...