 Fishbone Diagram
Fishbone Diagrams solution extends ConceptDraw DIAGRAM software with templates, samples and library of vector stencils for drawing the Ishikawa diagrams for cause and effect analysis.
 Fishbone Diagrams
The Fishbone Diagrams solution extends ConceptDraw DIAGRAM software with the ability to easily draw the Fishbone Diagrams (Ishikawa Diagrams) to clearly see the cause and effect analysis and also problem solving. The vector graphic diagrams produced using this solution can be used in whitepapers, presentations, datasheets, posters, and published technical material.
Competitor Analysis

 Sales Flowcharts
The Sales Flowcharts solution lets you create and display sales process maps, sales process workflows, sales steps, the sales process, and anything else involving sales process management.
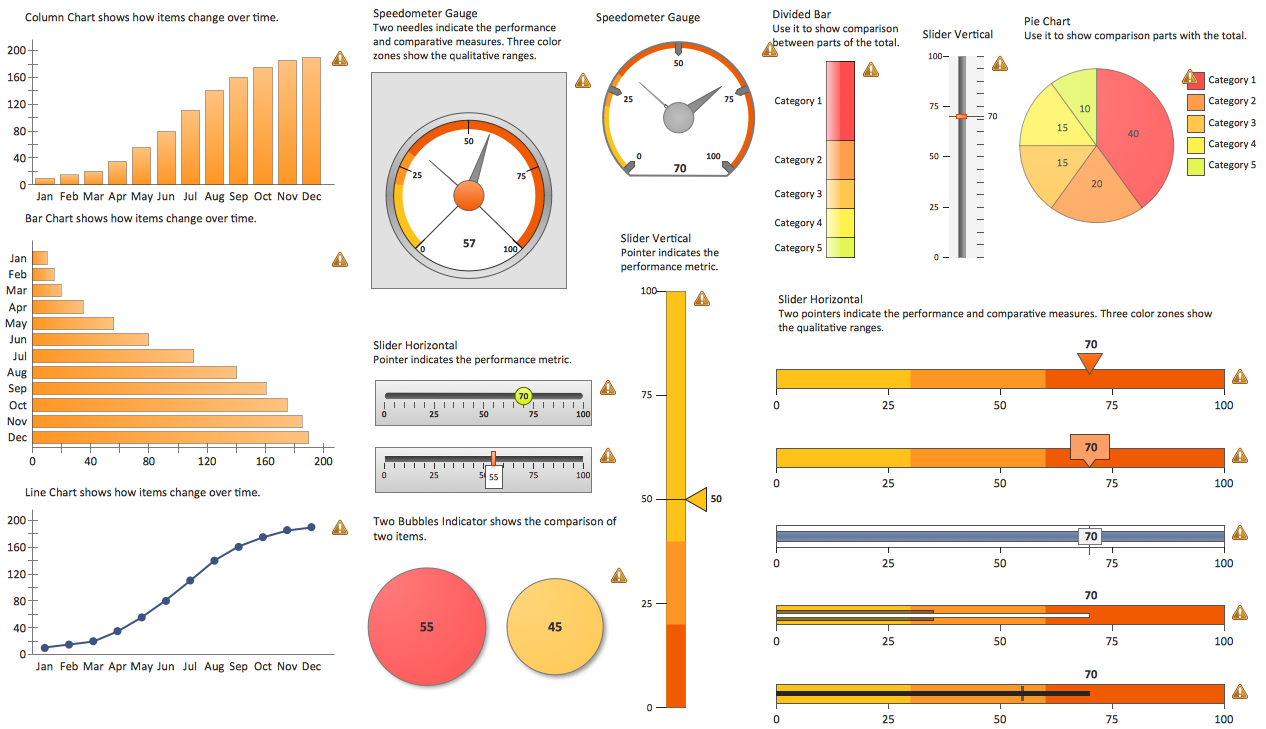
 Sales Dashboard
Sales Dashboard solution extends ConceptDraw DIAGRAM software with templates, samples and library of vector stencils for drawing the visual dashboards of sale metrics and key performance indicators (KPI).
Six Markets Model Chart

 Marketing Diagrams
Marketing Diagrams solution extends ConceptDraw DIAGRAM diagramming software with abundance of samples, templates and vector design elements intended for easy graphical visualization and drawing different types of Marketing diagrams and graphs, including Branding Strategies Diagram, Five Forces Model Diagram, Decision Tree Diagram, Puzzle Diagram, Step Diagram, Process Chart, Strategy Map, Funnel Diagram, Value Chain Diagram, Ladder of Customer Loyalty Diagram, Leaky Bucket Diagram, Promotional Mix Diagram, Service-Goods Continuum Diagram, Six Markets Model Diagram, Sources of Customer Satisfaction Diagram, etc. Analyze effectively the marketing activity of your company and apply the optimal marketing methods with ConceptDraw DIAGRAM software.
KPI Dashboard

Business diagrams & Org Charts with ConceptDraw DIAGRAM


KPIs and Metrics

A KPI Dashboard
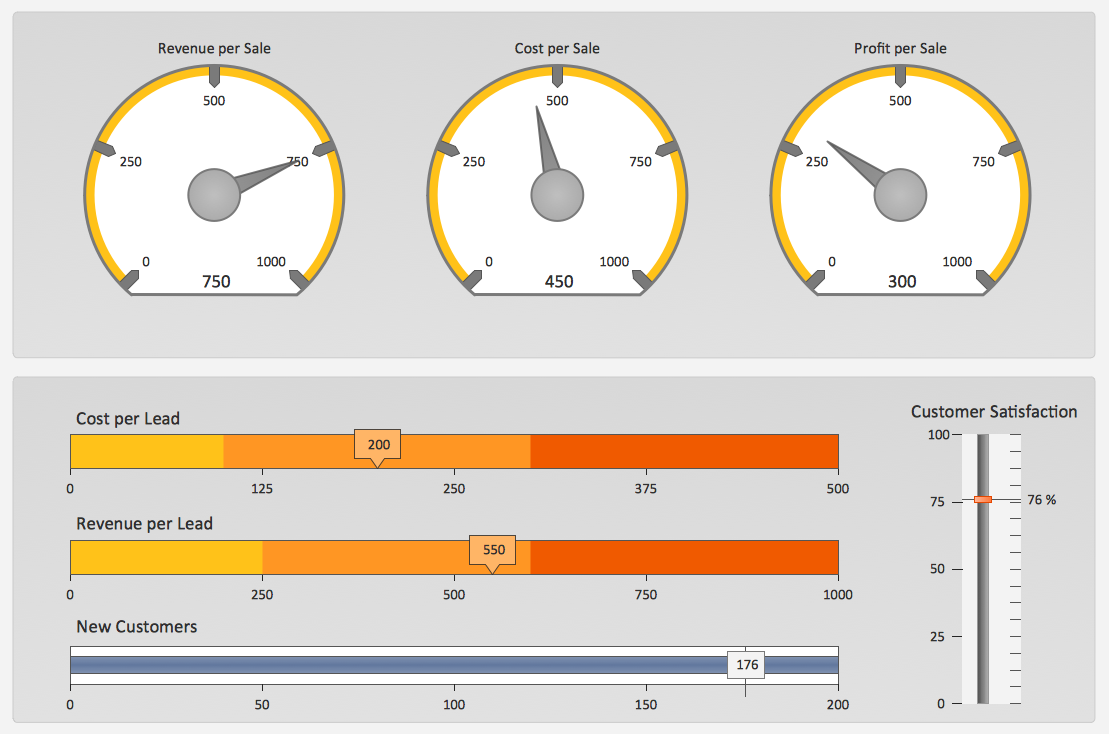
Sales Dashboard Template

 Target and Circular Diagrams
This solution extends ConceptDraw DIAGRAM software with samples, templates and library of design elements for drawing the Target and Circular Diagrams.
Sales Dashboards for Your Company
- Fishbone Diagram Sample For Sales Marketing
- Fishbone Diagrams | Fishbone Diagram | Sales KPI Dashboards ...
- Ishikawa Diagram Sales
- Fishbone Diagram For Marketing
- Marketing Diagram Ticket Sales
- Entity-Relationship Diagram (ERD) | Marketing | Fishbone Diagram ...
- Fish Bone Diagram For Sales Decreased
- The Fish Bone Diagram In Service Marketing
- Fishbone Diagram In Marketing Of Services
- Sales KPI Dashboards | Fishbone Diagrams | Sales Dashboard ...
- Marketing - Design Elements | Fishbone Diagrams | Sales symbols ...
- Marketing Fishbone Diagram
- Cause and Effect Analysis - Fishbone Diagrams for Problem Solving ...
- Marketing and Sales Organization chart . Organization chart Example
- Service Marketing Diagram
- Astronomy and Astrology | Marketing and Sales Organization chart ...
- Cause and Effect Analysis - Fishbone Diagrams for Problem Solving ...
- Sales Diagram Examples
- Sales Diagrams