How to Make a Timeline

HelpDesk
How to Create a Timeline Diagram in ConceptDraw PRO

Project Timeline

You need to make professional looking project timeline? Create it with ConceptDraw PRO! ConceptDraw PRO extended with Timeline Diagrams Solution from the Management Area is the best timeline diagrams software
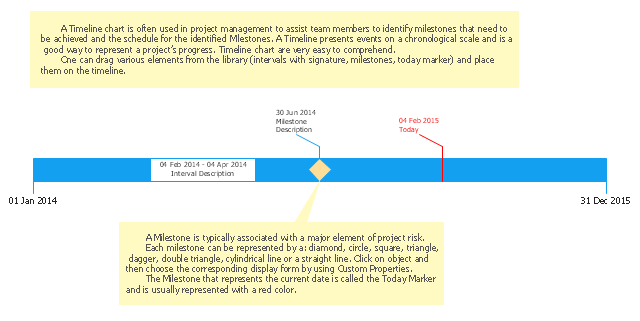
Timeline charts presents events and time periods on a chronological scale. They are used in project management to visualize project milestones and upper level phases, and show project progress.
"Time is one of the most critical resources in any project. Good planning spreads the necessary work over a reasonable period of time. This allows everyone to work at a consistent, sustainable pace. Poor planning leaves people stuck and idle, then forces them to scramble to catch up later on. While it does take time to plan ahead, the time ... saved more than make up for it. Good planning is a part of good doing. ...
A Timeline is a clean and concise visual representation of a series of events. It helps you to arrange large chunks of time and see the overall plan easily." [education.rec.ri.cmu.edu/ previews/ nxt_ products/ robotics_ eng_ vol_ 2/ preview/ content/ timeline.pdf]
This timeline template for the ConceptDraw PRO diagramming and vector drawing software is included in the Timeline Diagrams solution from the Management area of ConceptDraw Solution Park.
Timeline template
"The RFP presents preliminary requirements for the commodity or service, and may dictate to varying degrees the exact structure and format of the supplier's response. Effective RFPs typically reflect the strategy and short/ long-term business objectives, providing detailed insight upon which suppliers will be able to offer a matching perspective. ...
RFP:
(1) informs suppliers that an organization is looking to procure and encourages them to make their best effort.
(2) requires the company to specify what it proposes to purchase. If the requirements analysis has been prepared properly, it can be incorporated quite easily into the Request document.
(3) alerts suppliers that the selection process is competitive.
(4) allows for wide distribution and response.
(5) ensures that suppliers respond factually to the identified requirements.
(6) is generally expected to follow a structured evaluation and selection procedure, so that an organization can demonstrate impartiality - a crucial factor in public sector procurements." [Request for proposal. Wikipedia]
The project plan timeline diagram example "Request for proposal (RFP)" was created using the ConceptDraw PRO diagramming and vector drawing software extended with the Timeline Diagrams solution from the Management area of ConceptDraw Solution Park.
Project timeline
.png--diagram-flowchart-example.png)
 Business Processes
Business Process solution extends ConceptDraw PRO software with business process diagrams as cross-functional flowcharts, workflows, process charts, IDEF0, timelines, calendars, Gantt charts, business process modeling, audit and opportunity flowcharts.
HelpDesk
How to Shift Dates in ConceptDraw PROJECT

Gantt Chart Software

 ConceptDraw Solution Park
ConceptDraw Solution Park collects graphic extensions, examples and learning materials
HelpDesk
How to Draw a Circular Arrows Diagram Using ConceptDraw PRO

HelpDesk
What Information to be Displayed in the ConceptDraw PROJECT Gantt Chart View


HelpDesk
How to Create a Gantt Chart for Your Project

Gant Chart is a graphical representation of tasks as segments on a time scale. It helps plan or overlapping.
How To create Value Stream Map (VSM)

Create a Value Stream Map
 example")
HelpDesk
How to Make an Ansoff Matrix Template in ConceptDraw PRO

Learn how to create a current state value stream map

HelpDesk
How to Make a Project Tasks Mind Map from Brainstorm


 PM Easy
This solution extends ConceptDraw PROJECT software with the ability to quickly start a project; it lists task relationships and dependencies to make iterative planning easy.
Value Stream Maps Visualize
 vector stencils")
- How to Create a Timeline Diagram in ConceptDraw PRO | Timeline ...
- Project timeline diagram - New business project plan ...
- How To Create Good Presentation Ideas | Timeline Diagrams ...
- Management | Marketing | ConceptDraw PRO The best Business ...
- Timeline Diagrams | Line Chart Examples | Line Graph Charting ...
- Business Processes | Business Process Mapping — How to Map a ...
- Timeline Diagrams | Project plan timeline - Request for proposal ...
- Project timeline diagram
- How To Create Restaurant Floor Plans in Minutes | Timeline ...
- Timeline Diagrams | Gantt Chart Software | How to Report Task's ...
- Timeline template | Examples of Flowcharts, Org Charts and More ...
- Timeline Diagrams | Management | Marketing | Concept Draw Pro ...
- Timeline Diagrams | Timeline diagram template | Project timeline ...
- PM Presentations | Communication Tool for Remote Project ...
- Project timeline diagram
- Project timeline diagram - New business project plan | Project plan ...
- Project timeline diagram | Design elements - Timelines solution ...
- Project timeline diagram | Gantt Chart Software | Business diagrams ...
- Timeline Diagrams | Line Chart Examples | Line Graph Charting ...
- Timeline Diagrams | Timeline template | Timeline diagram | How To ...