 ConceptDraw Solution Park
ConceptDraw Solution Park collects graphic extensions, examples and learning materials
HelpDesk
How to Create a Picture Graph in ConceptDraw PRO

 Line Graphs
How to draw a Line Graph with ease? The Line Graphs solution extends the capabilities of ConceptDraw PRO v10 with professionally designed templates, samples, and a library of vector stencils for drawing perfect Line Graphs.
 Bar Graphs
The Bar Graphs solution enhances ConceptDraw PRO v10 functionality with templates, numerous professional-looking samples, and a library of vector stencils for drawing different types of Bar Graphs, such as Simple Bar Graph, Double Bar Graph, Divided Bar Graph, Horizontal Bar Graph, Vertical Bar Graph, and Column Bar Chart.
 Picture Graphs
Typically, a Picture Graph has very broad usage. They many times used successfully in marketing, management, and manufacturing. The Picture Graphs Solution extends the capabilities of ConceptDraw PRO v10 with templates, samples, and a library of professionally developed vector stencils for designing Picture Graphs.
Create Graphs and Charts

Sales Growth. Bar Graphs Example

Line Graph Charting Software

Financial Comparison Chart

 Marketing Diagrams
This solution extends ConceptDraw PRO with samples, templates and library of design elements for drawing the marketing diagrams.
Flowchart Example: Flow Chart of Marketing Analysis

Scatter Graph Charting Software

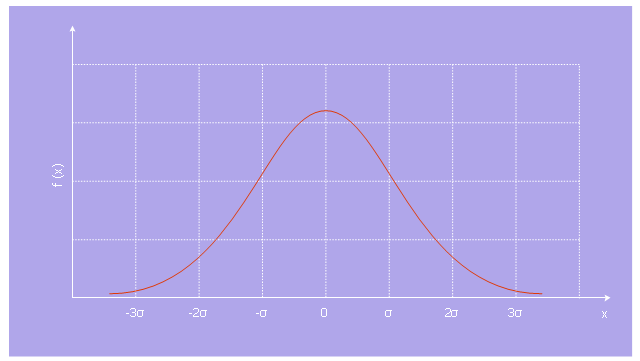
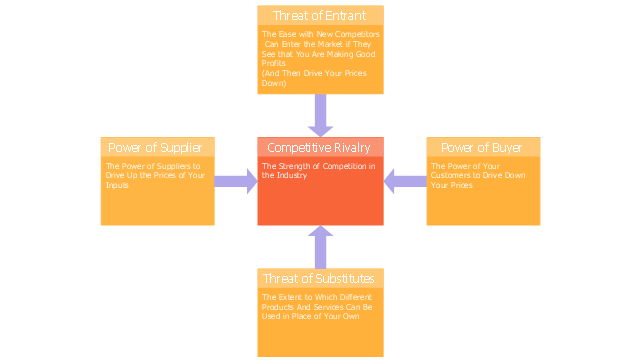
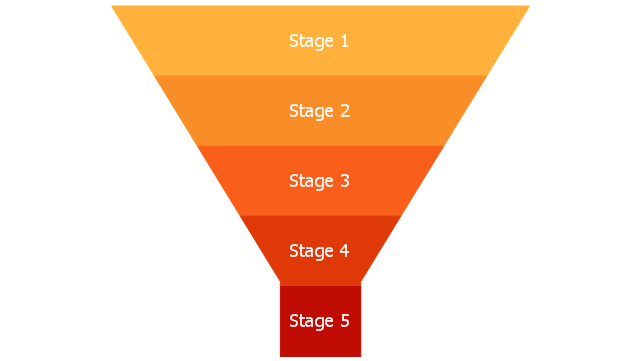
The vector stencils library "Marketing diagrams" contains 9 templates of marketing and sales diagrams and charts.
Use these shapes to illustrate your marketing and sales documents, presentations, infographics and webpages in the ConceptDraw PRO diagramming and vector drawing software extended with the Marketing Diagrams solution from the Marketing area of ConceptDraw Solution Park.
www.conceptdraw.com/ solution-park/ marketing-diagrams
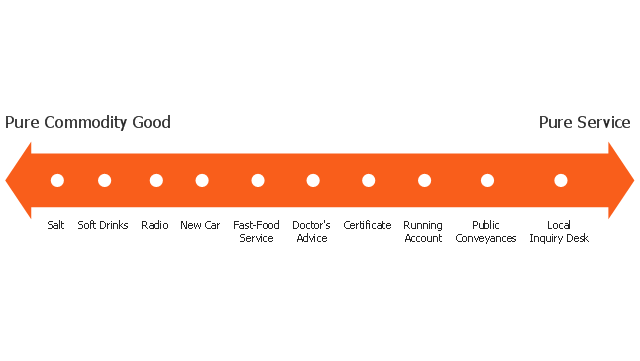
Service-goods continuum diagram
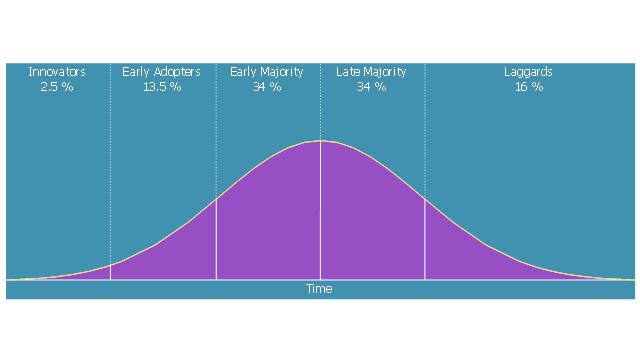
Diffusion of Innovations
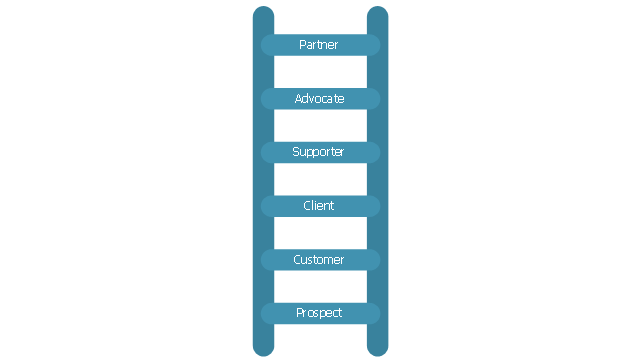
Relationship ladder of customer loyalty
Leaky bucket diagram

Normal distribution
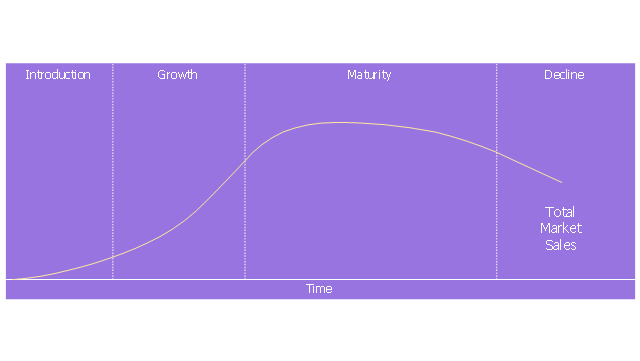
Product life cycle graph
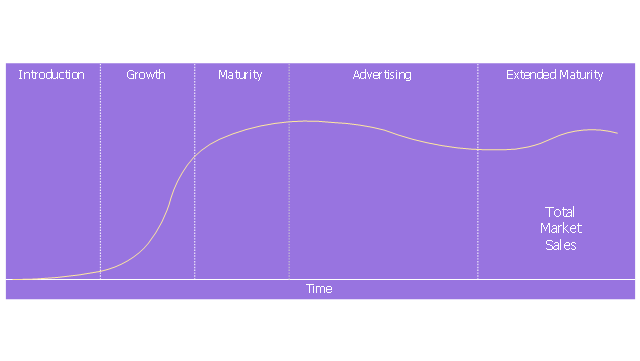
Extended product life cycle graph
Five forces model
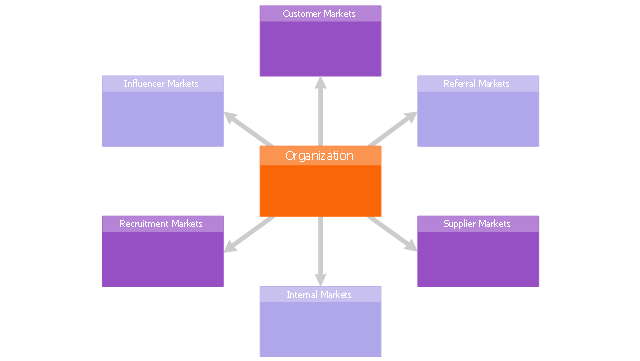
Six markets model
Step chart block
Step diagram block

Six Markets Model Chart

Chart Examples

HelpDesk
How to Create a Bar Chart in ConceptDraw PRO

Line Chart Examples

Bar Chart Examples

Chart Software for Better Presentations

Column Chart Examples

- Picture For Graph In Green Marketing
- Pie Chart Of Green Market Recent In 2016
- Green Marketing Charts
- Sample Marketing Graph
- Design elements - Marketing charts | How to Create a Picture Graph ...
- Marketing Concept With Graph
- Marketing Graphs
- Marketing Graph
- Marketing Bar And Chart Diagram About 2016 Status
- How to Create a Picture Graph in ConceptDraw PRO | Process ...
- How To Explain A Marketing Pie Chart Bar Chart
- Content marketing cycle - Diamond pie chart | Design elements ...
- Product life cycle graph
- Product life cycle graph | Marketing Diagrams
- Sales Growth. Bar Graphs Example | Sales department - Vector ...
- Market Picture Diagram And Graph
- Product life cycle graph
- Sales Growth. Bar Graphs Example | Sales Dashboard | Sales ...
- Product life cycle process - Flowchart | Product life cycle graph ...