HelpDesk
How to Create a Picture Graph in ConceptDraw PRO

 ConceptDraw Solution Park
ConceptDraw Solution Park collects graphic extensions, examples and learning materials
 Line Graphs
Line Graphs solution extends ConceptDraw PRO software with templates, samples and library of vector stencils for drawing the line charts.
 Bar Graphs
Bar graphs solution extends ConceptDraw PRO software with templates, samples and library of vector stencils for drawing the bar charts.
 Picture Graphs
Picture Graphs solution extends ConceptDraw PRO software with templates, samples and library of vector stencils for drawing the picture charts.
Line Graph Charting Software

Create Graphs and Charts

 Marketing Diagrams
This solution extends ConceptDraw PRO with samples, templates and library of design elements for drawing the marketing diagrams.
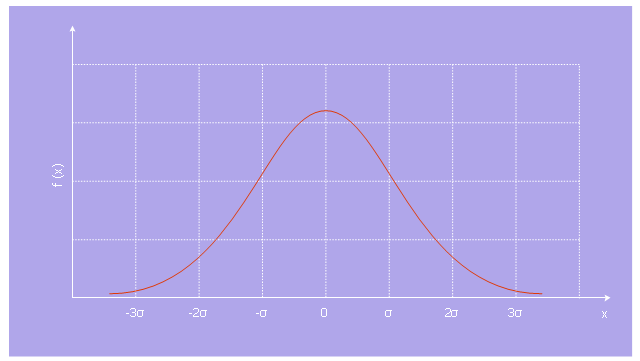
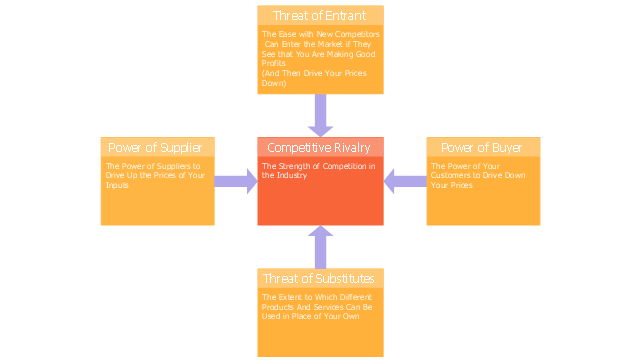
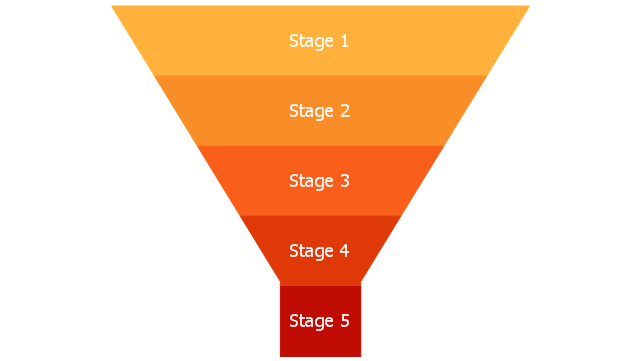
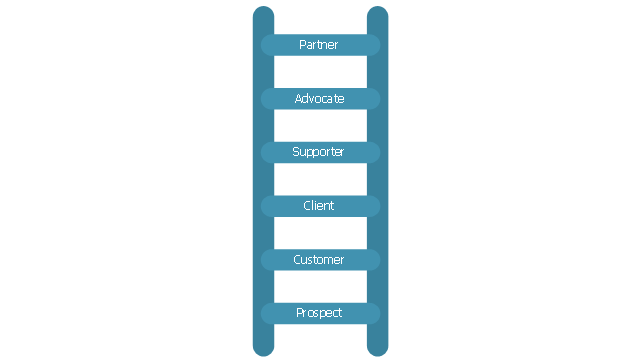
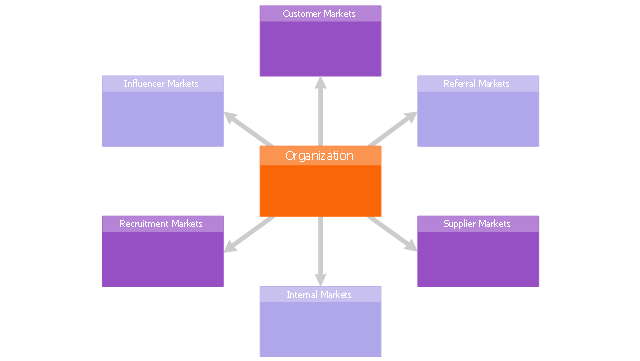
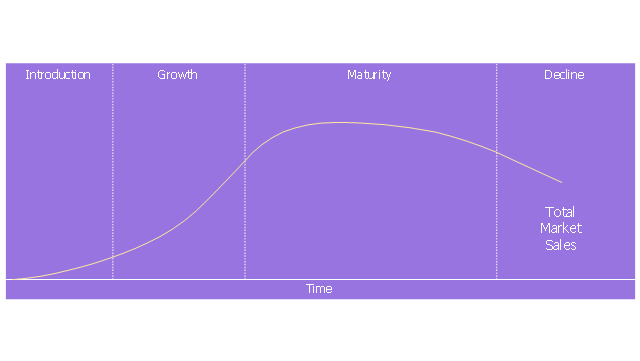
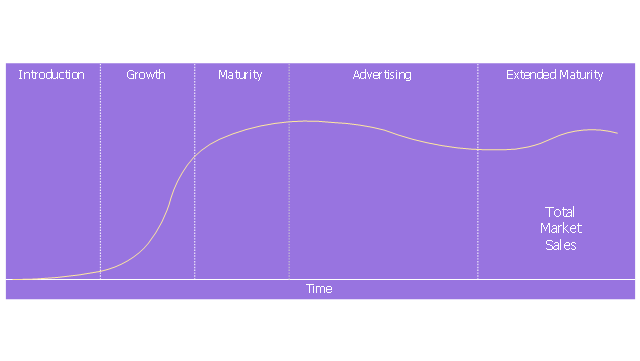
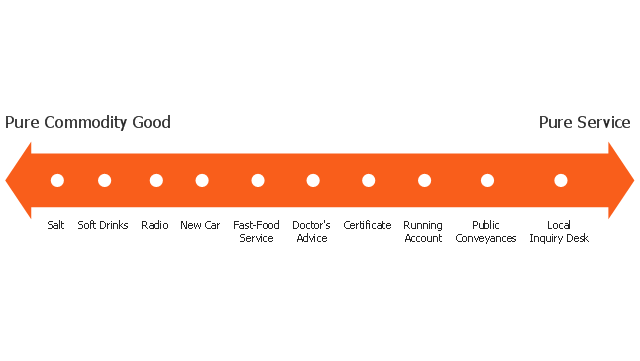
The vector stencils library "Marketing diagrams" contains 9 templates of marketing and sales diagrams and charts.
Use these shapes to illustrate your marketing and sales documents, presentations, infographics and webpages in the ConceptDraw PRO diagramming and vector drawing software extended with the Marketing Diagrams solution from the Marketing area of ConceptDraw Solution Park.
www.conceptdraw.com/ solution-park/ marketing-diagrams
Service-goods continuum diagram
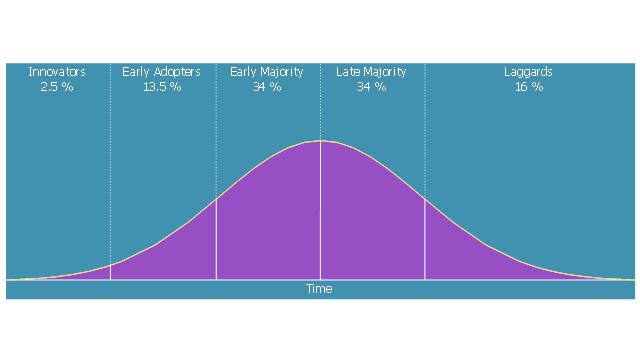
Diffusion of Innovations
Relationship ladder of customer loyalty
Leaky bucket diagram

Normal distribution
Product life cycle graph
Extended product life cycle graph
Five forces model
Six markets model
Step chart block
Step diagram block

Sales Growth. Bar Graphs Example

Scatter Graph Charting Software

Financial Comparison Chart

Flowchart Example: Flow Chart of Marketing Analysis

Chart Examples

Bar Chart Examples

 Holiday
The Holiday Solution from Illustration area of ConceptDraw Solution Park contains holiday illustration examples, templates and vector clipart library.
"Brand essence is a phrase that communicates the fundamental nature of a trade name associated with one or more products made by the same company. A business marketing team will often spend considerable time developing effective ways of expressing the brand essence of their company's various brands by highlighting the unique benefits provided that pertain to the values of its target subculture." [businessdictionary.com/ definition/ brand-essence.html]
Brand essence model diagram visually display key points of brand essence in easy to understand form.
The example of wheel diagram (ring diagram, bevel style circle diagram) "Brand essence model" was created using the ConceptDraw PRO diagramming and vector drawing software extended with the Target and Circular Diagrams solution from the Marketing area of ConceptDraw Solution Park.
www.conceptdraw.com/ solution-park/ marketing-target-and-circular-diagrams
Wheel diagram

Chart Software for Better Presentations

Graphs and Charts Area provide a wide collection of professional looking predesigned templates, samples and ready-to-use vector stencils that will help you to draw the charts and diagrams of various types: Pie Charts, Donut Charts, Line Charts, Column Charts, Bar Charts, Pyramids, Scatter Charts, Venn Diagrams, Spider Charts, Area Charts, Divided Bar Graphs.
Line Chart Examples

Pie Chart Examples and Templates

Pie chart examples and templates created using ConceptDraw PRO software helps you get closer with pie charts and find pie chart examples suite your needs.
- Picture For Graph In Green Marketing
- Graphs About Green Marketing
- Design elements - Marketing charts | How to Create a Picture Graph ...
- Marketing Concept With Graph
- Green Marketing Charts
- Pie Chart Of Green Market Recent In 2016
- Process Flowchart | How to Create a Picture Graph in ConceptDraw ...
- How To Explain A Marketing Pie Chart Bar Chart
- Content marketing cycle - Diamond pie chart | Pie Chart Examples ...
- Marketing Bar And Chart Diagram About 2016 Status
- Product life cycle graph
- Marketing | Bar Chart Software | Chart Examples | Marketing Graph
- Product life cycle graph | Marketing Diagrams
- Marketing | SWOT Sample in Computers | Picture Graphs | Swot ...
- Product life cycle graph
- Marketing Charts | Design elements - Marketing charts | Market ...
- Product life cycle process - Flowchart | Product life cycle graph ...
- Product life cycle graph template | Marketing Diagrams | Good Flow ...
- Market Picture Diagram And Graph
- Sales Growth. Bar Graphs Example | Sales department - Vector ...