Types of Flowcharts


How to Build a Flowchart

Flowchart Design Flowchart Symbols, Shapes, Stencils and Icons


"In mathematics, the Euclidean algorithm, or Euclid's algorithm, is a method for computing the greatest common divisor (GCD) of two (usually positive) integers, also known as the greatest common factor (GCF) or highest common factor (HCF). ...
The GCD of two positive integers is the largest integer that divides both of them without leaving a remainder (the GCD of two integers in general is defined in a more subtle way).
In its simplest form, Euclid's algorithm starts with a pair of positive integers, and forms a new pair that consists of the smaller number and the difference between the larger and smaller numbers. The process repeats until the numbers in the pair are equal. That number then is the greatest common divisor of the original pair of integers.
The main principle is that the GCD does not change if the smaller number is subtracted from the larger number. ... Since the larger of the two numbers is reduced, repeating this process gives successively smaller numbers, so this repetition will necessarily stop sooner or later - when the numbers are equal (if the process is attempted once more, one of the numbers will become 0)." [Euclidean algorithm. Wikipedia]
The flowchart example "Euclidean algorithm" was created using the ConceptDraw PRO diagramming and vector drawing software extended with the Mathematics solution from the Science and Education area of ConceptDraw Solution Park.
Euclid's algorithm flow chart

Ordering Process Flowchart. Flowchart Examples

Simple Flow Chart

Check Order Process Flowchart. Flowchart Examples

Basic Diagramming Flowchart Software

Creating a Simple Flowchart

"In elementary algebra, a quadratic equation (from the Latin quadratus for "square") is any equation having the form
ax^2+bx+c=0
where x represents an unknown, and a, b, and c are constants with a not equal to 0. If a = 0, then the equation is linear, not quadratic. The constants a, b, and c are called, respectively, the quadratic coefficient, the linear coefficient and the constant or free term.
Because the quadratic equation involves only one unknown, it is called "univariate". The quadratic equation only contains powers of x that are non-negative integers, and therefore it is a polynomial equation, and in particular it is a second degree polynomial equation since the greatest power is two.
Quadratic equations can be solved by a process known in American English as factoring and in other varieties of English as factorising, by completing the square, by using the quadratic formula, or by graphing." [Quadratic equation. Wikipedia]
The flowchart example "Solving quadratic equation algorithm" was created using the ConceptDraw PRO diagramming and vector drawing software extended with the Mathematics solution from the Science and Education area of ConceptDraw Solution Park.
Solving quadratic equation flow chart

Flowchart Maker

Create Flowchart - Making a Flowchart

Linux Audit Flowchart Example. Flowchart Examples

Flowchart Programming Project. Flowchart Examples

Flowchart Software

Workflow Application

Horizontal Flowchart

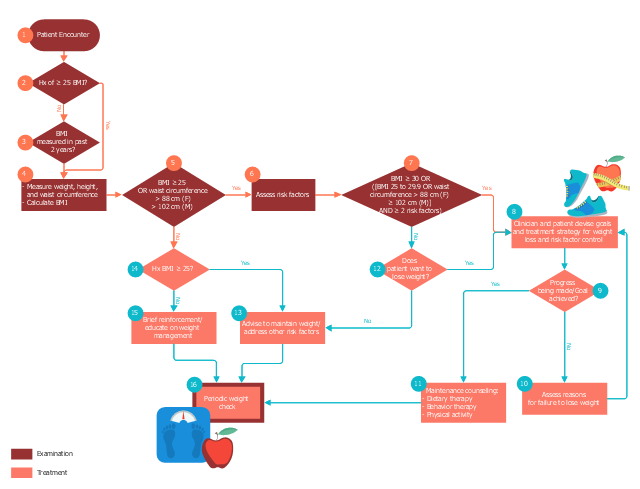
This medical flowchart sample shows assessment and treatment algorithm for overweight and obesity.
It was drawn on the base of Wikimedia Commons file: Assessment and treatment algorithm for overweight and obesity.png. [commons.wikimedia.org/ wiki/ File:Assessment_ and_ treatment_ algorithm_ for_ overweight_ and_ obesity.png]
"A medical algorithm is any computation, formula, statistical survey, nomogram, or look-up table, useful in healthcare. Medical algorithms include decision tree approaches to healthcare treatment (e.g., if symptoms A, B, and C are evident, then use treatment X) and also less clear-cut tools aimed at reducing or defining uncertainty." [Medical algorithm. Wikipedia]
The medical flow chart example "Assessment and treatment algorithm for overweight and obesity" was designed using ConceptDraw PRO software extended with Healthcare Workflow Diagrams solution from Business Processes area of ConceptDraw Solution Park.
Medical flowchart
DFD Flowchart Symbols

- Flowchart Programming Project. Flowchart Examples | Euclidean ...
- Diagram Flow Chart | Selection Sort Algorithm And Its Flowchart
- Basic Flowchart Symbols and Meaning | Types of Flowcharts ...
- Flowchart Components | Spatial infographics Design Elements ...
- Mathematics | Illustrate Flow Chart And Algorithm With Equations
- Database Flowchart Symbols | SDL Flowchart Symbols | Basic of ...
- Euclidean algorithm - Flowchart | How to Create a Timeline Diagram ...
- Diagram Flow Chart | Creating a Simple Flowchart | Flowchart ...
- Solving quadratic equation algorithm - Flowchart | Basic ...
- Euclidean algorithm - Flowchart | Solving quadratic equation ...