"In mathematics, the Euclidean algorithm, or Euclid's algorithm, is a method for computing the greatest common divisor (GCD) of two (usually positive) integers, also known as the greatest common factor (GCF) or highest common factor (HCF). ...
The GCD of two positive integers is the largest integer that divides both of them without leaving a remainder (the GCD of two integers in general is defined in a more subtle way).
In its simplest form, Euclid's algorithm starts with a pair of positive integers, and forms a new pair that consists of the smaller number and the difference between the larger and smaller numbers. The process repeats until the numbers in the pair are equal. That number then is the greatest common divisor of the original pair of integers.
The main principle is that the GCD does not change if the smaller number is subtracted from the larger number. ... Since the larger of the two numbers is reduced, repeating this process gives successively smaller numbers, so this repetition will necessarily stop sooner or later - when the numbers are equal (if the process is attempted once more, one of the numbers will become 0)." [Euclidean algorithm. Wikipedia]
The flowchart example "Euclidean algorithm" was created using the ConceptDraw PRO diagramming and vector drawing software extended with the Mathematics solution from the Science and Education area of ConceptDraw Solution Park.
Euclid's algorithm flow chart

"In elementary algebra, a quadratic equation (from the Latin quadratus for "square") is any equation having the form
ax^2+bx+c=0
where x represents an unknown, and a, b, and c are constants with a not equal to 0. If a = 0, then the equation is linear, not quadratic. The constants a, b, and c are called, respectively, the quadratic coefficient, the linear coefficient and the constant or free term.
Because the quadratic equation involves only one unknown, it is called "univariate". The quadratic equation only contains powers of x that are non-negative integers, and therefore it is a polynomial equation, and in particular it is a second degree polynomial equation since the greatest power is two.
Quadratic equations can be solved by a process known in American English as factoring and in other varieties of English as factorising, by completing the square, by using the quadratic formula, or by graphing." [Quadratic equation. Wikipedia]
The flowchart example "Solving quadratic equation algorithm" was created using the ConceptDraw PRO diagramming and vector drawing software extended with the Mathematics solution from the Science and Education area of ConceptDraw Solution Park.
Solving quadratic equation flow chart

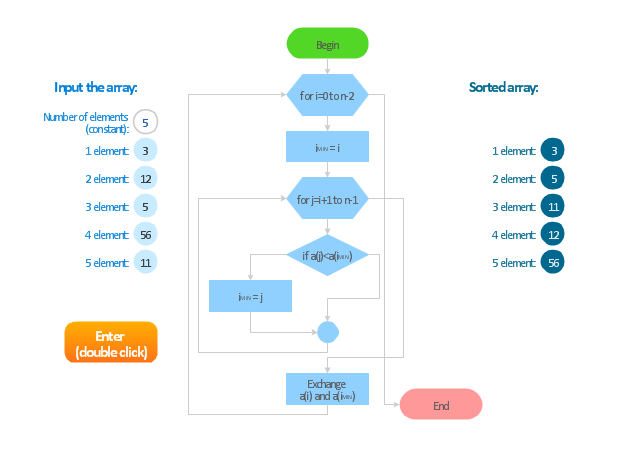
"In mathematics and computer science, an algorithm ... is a step-by-step procedure for calculations. Algorithms are used for calculation, data processing, and automated reasoning.
An algorithm is an effective method expressed as a finite list of well-defined instructions for calculating a function. Starting from an initial state and initial input (perhaps empty), the instructions describe a computation that, when executed, proceeds through a finite number of well-defined successive states, eventually producing "output" and terminating at a final ending state. The transition from one state to the next is not necessarily deterministic; some algorithms, known as randomized algorithms, incorporate random input." [Algorithm. Wikipedia]
The algorithm flow chart example "Selection sorting method" was created using the ConceptDraw PRO diagramming and vector drawing software extended with the Flowcharts solution from the area "What is a Diagram" of ConceptDraw Solution Park.
Flowchart - Selection sorting method
This medical flowchart sample shows assessment and treatment algorithm for overweight and obesity.
It was drawn on the base of Wikimedia Commons file: Assessment and treatment algorithm for overweight and obesity.png. [commons.wikimedia.org/ wiki/ File:Assessment_ and_ treatment_ algorithm_ for_ overweight_ and_ obesity.png]
"A medical algorithm is any computation, formula, statistical survey, nomogram, or look-up table, useful in healthcare. Medical algorithms include decision tree approaches to healthcare treatment (e.g., if symptoms A, B, and C are evident, then use treatment X) and also less clear-cut tools aimed at reducing or defining uncertainty." [Medical algorithm. Wikipedia]
The medical flow chart example "Assessment and treatment algorithm for overweight and obesity" was designed using ConceptDraw PRO software extended with Healthcare Workflow Diagrams solution from Business Processes area of ConceptDraw Solution Park.
Medical flowchart
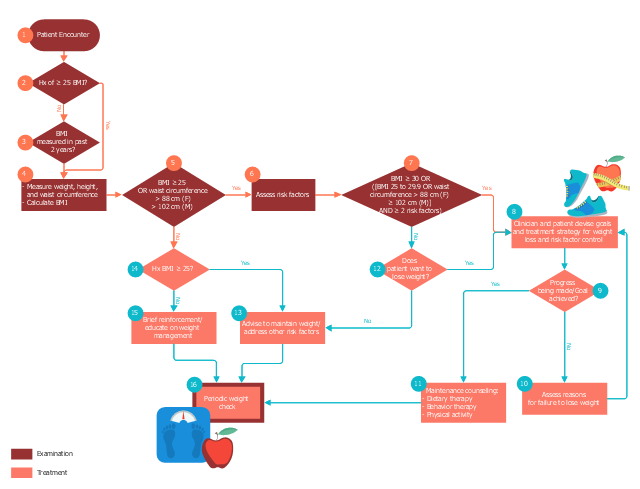
Diagram Flow Chart

Ordering Process Flowchart. Flowchart Examples

Flow Chart Design - How to Design a Good Flowchart

Types of Flowcharts


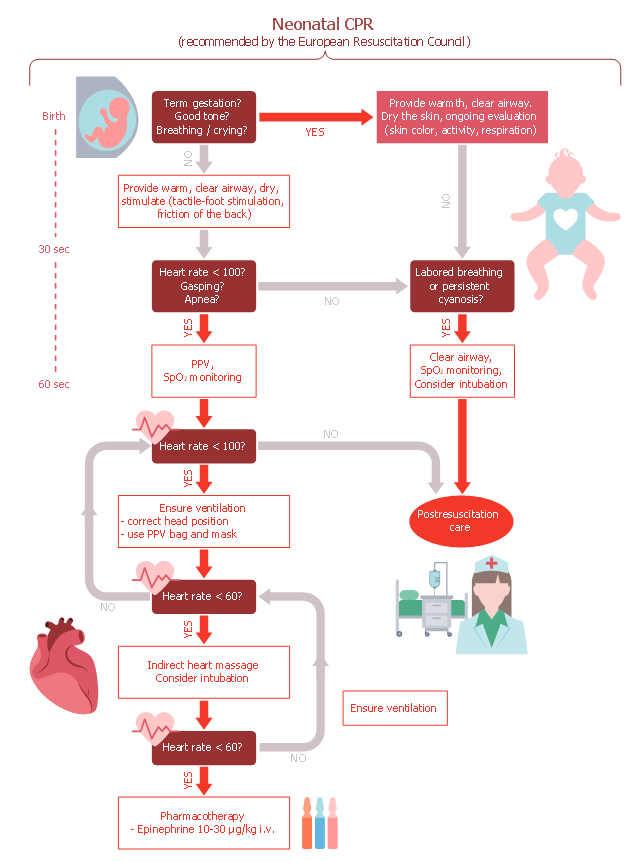
This medical algorithm flowchart sample depicts cardiopulmonary resuscitation (CPR) of newborn infants.
It was drawn on the base of Wikimedia Commons file: KPR novorozence.png. [commons.wikimedia.org/ wiki/ File:KPR_ novorozence.png]
This file is licensed under the Creative Commons Attribution 3.0 Unported license. [creativecommons.org/ licenses/ by/ 3.0/ deed.en]
"Cardiopulmonary resuscitation (CPR) is an emergency procedure that combines chest compressions often with artificial ventilation in an effort to manually preserve intact brain function until further measures are taken to restore spontaneous blood circulation and breathing in a person who is in cardiac arrest. It is recommended in those who are unresponsive with no breathing or abnormal breathing" [Cardiopulmonary resuscitation. Wikipedia]
The medical algorithm flow chart example "Cardiopulmonary resuscitation of newborn infants" was designed using ConceptDraw PRO software extended with Healthcare Workflow Diagrams solution from Business Processes area of ConceptDraw Solution Park.
Medical algorithm flowchart
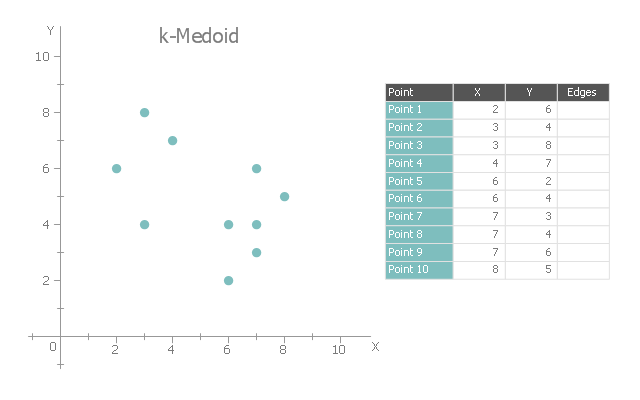
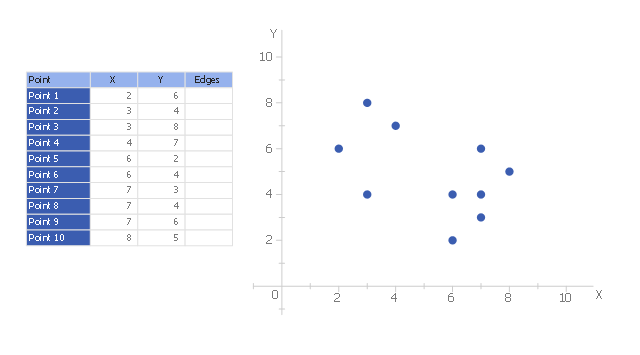
This scatter graph sample illustrates k-medoids algorithm.
"The k-medoids algorithm is a clustering algorithm related to the k-means algorithm and the medoidshift algorithm. Both the k-means and k-medoids algorithms are partitional (breaking the dataset up into groups) and both attempt to minimize the distance between points labeled to be in a cluster and a point designated as the center of that cluster." [K-medoids. Wikipedia]
The scatterplot example "k-Medoid" was created using the ConceptDraw PRO diagramming and vector drawing software extended with the Scatter Diagrams solution from the Graphs and Charts area of ConceptDraw Solution Park.
Scatterplot
This scatter plot sample is used to illustrate the k-medoid clustering algorithm.
"The k-medoids algorithm is a clustering algorithm related to the k-means algorithm and the medoidshift algorithm. Both the k-means and k-medoids algorithms are partitional (breaking the dataset up into groups) and both attempt to minimize the distance between points labeled to be in a cluster and a point designated as the center of that cluster." [en.wikipedia.org/ wiki/ K-medoids]
The scatterplot example "k-Medoid clustering" was created using the ConceptDraw PRO diagramming and vector drawing software extended with the Basic Scatter Diagrams solution from the Graphs and Charts area of ConceptDraw Solution Park.
Scatterplot
Amazon Web Services Diagrams diagramming tool for architecture

Conference Planning

Flowchart Software

How To Create a FlowChart using ConceptDraw

Basic Diagramming


Create Flow Chart on Mac

Flow Chart

Graphical Symbols to use in EPC diagrams

Flowchart Programming Project. Flowchart Examples

- Euclidean algorithm - Flowchart | Solving quadratic equation ...
- Solving quadratic equation algorithm - Flowchart | Mathematics ...
- Solving quadratic equation algorithm - Flowchart | Algorithm To ...
- Euclidean algorithm - Flowchart | Flow Chart To Elaborate And ...
- Solving quadratic equation algorithm - Flowchart | Algorithm And ...
- How to Draw a Pie Chart | Euclidean algorithm - Flowchart | | Draw A ...
- Solving quadratic equation algorithm - Flowchart | Euclidean ...
- Selection sorting method - Algorithm flowchart | Flowchart Of ...
- Similarities Between Flow Chart And Algorithm
- Process Flowchart | Flowchart Software | Flowchart Software Free ...
- | Pc Algorithm And Flowchart App Download
- Euclidean algorithm - Flowchart | Basic Flowchart Symbols and ...
- Flowcharts | Write An Algorithm And Flowchart To Withdraw A ...
- Hotel Management System Algorithm And Flowchart
- Methods Of Algorithm Representation With Data Flow Diagram Pdf
- Characteristics Of Algorithm And Flowchart
- Student Information Management System Algorithm And Flowchart
- Business Process Diagrams | The Algorithm And Flow Chart On ...
- Solving quadratic equation algorithm - Flowchart | Algorithm Of ...
- Solving quadratic equation algorithm - Flowchart | Write An ...