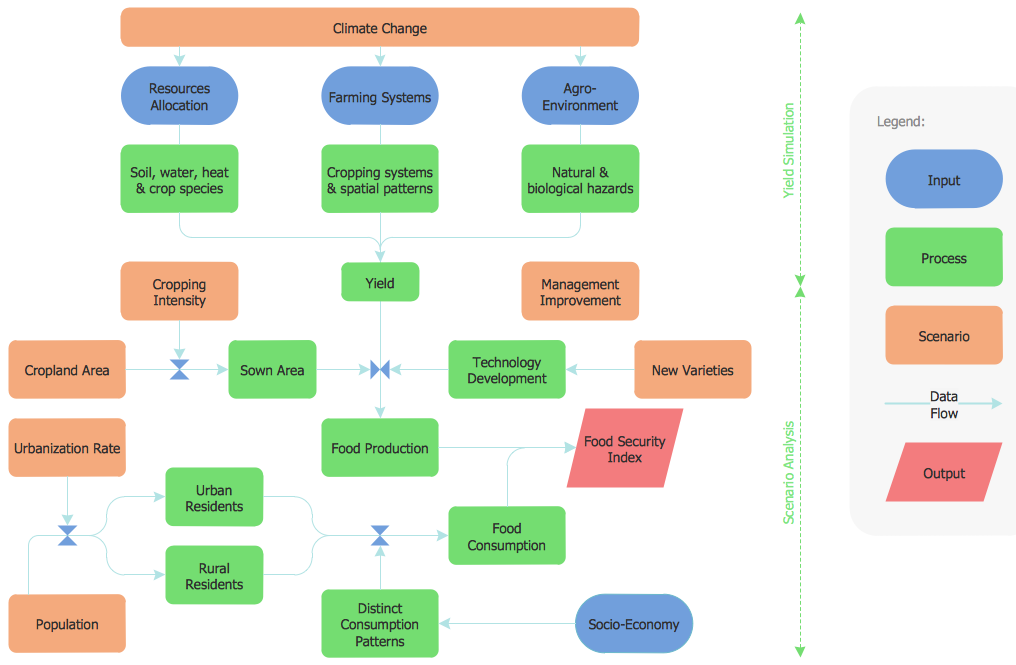
Example 1. Flow Chart — Food Security Assessment
Create a Flow Chart
The Flowcharts Solution offers 2 libraries with all commonly used shapes for drawing any Flow Chart you need. Below you can see them all, click on the preview to enlarge it.
All these objects are vector objects, you can resize them without loss of quality, change their color to make your flow chart diagram more interesting, bright and attractive.
To design your own Flow Chart in minutes, follow the next steps:
- drag the required shapes from the libraries,
- type the text inside the shapes,
- arrange the shapes and connect them with arrows.

Example 2. Flowcharts Solution in ConceptDraw STORE
You can also use the ready sample flow chart or template offered by Flowcharts solution in ConceptDraw STORE as the base or as the source of inspiration for your own Flow Chart.
Benefits of Flow Chart
The Flow Chart has a wide set of benefits:
- gives a clear documentation of a process;
- allows to define and offers common understanding of processes;
- helps to build a process visual representation for analysis, discussion, and communication;
- allows to identify the scope of the process;
- allows to trace and analyze the process steps;
- helps to standardize and find areas for monitoring, improvement and increased efficiency in a process;
- allows to find and detach the steps of the process that are not essential;
- helps in understanding the logic of complex problems;
- offers a guidance for managers overseeing operations;
- facilitates communication between programmers and business people;
- helps programmers to write the programs of any complexity and on the any high level language;
- helps in debugging process and provides efficient program maintenance;
- helps to understand and explain to other people the logic of the complex problems and their solution;
- assists to improve teamwork effectiveness.

Example 3. Flow Сhart — Synthetic Object Construction
The samples you see on this page were created in ConceptDraw DIAGRAM software using the flow chart symbols and shapes from the Flowcharts solution libraries. Each Flow Chart sample you see here is professionally looking and successfully demonstrates solution's capabilities and professional results you can achieve using it. An experienced user spent 10 minutes creating each of these samples.
Use the Flowcharts Solution for ConceptDraw DIAGRAM software to create your own Flow Chart or Org Flow Chart of any complexity quick, easy and effective.
All source documents are vector graphic documents. They are available for reviewing, modifying, or converting to a variety of formats (PDF file, MS PowerPoint, MS Visio, and many other graphic formats) from the ConceptDraw STORE. The Flowcharts Solution is available for all ConceptDraw DIAGRAM or later users.
TEN RELATED HOW TO's:
You need to draw the Bar Graph? The automated tool can be useful for you. ConceptDraw DIAGRAM diagramming and vector drawing software extended with Bar Graphs solution from Graphs and Charts area of ConceptDraw Solution Park will help you create any Bar Graph.
Picture: Bar Graph
Related Solution:
Create flowcharts, flow charts, and more with ConceptDraw flowchart software.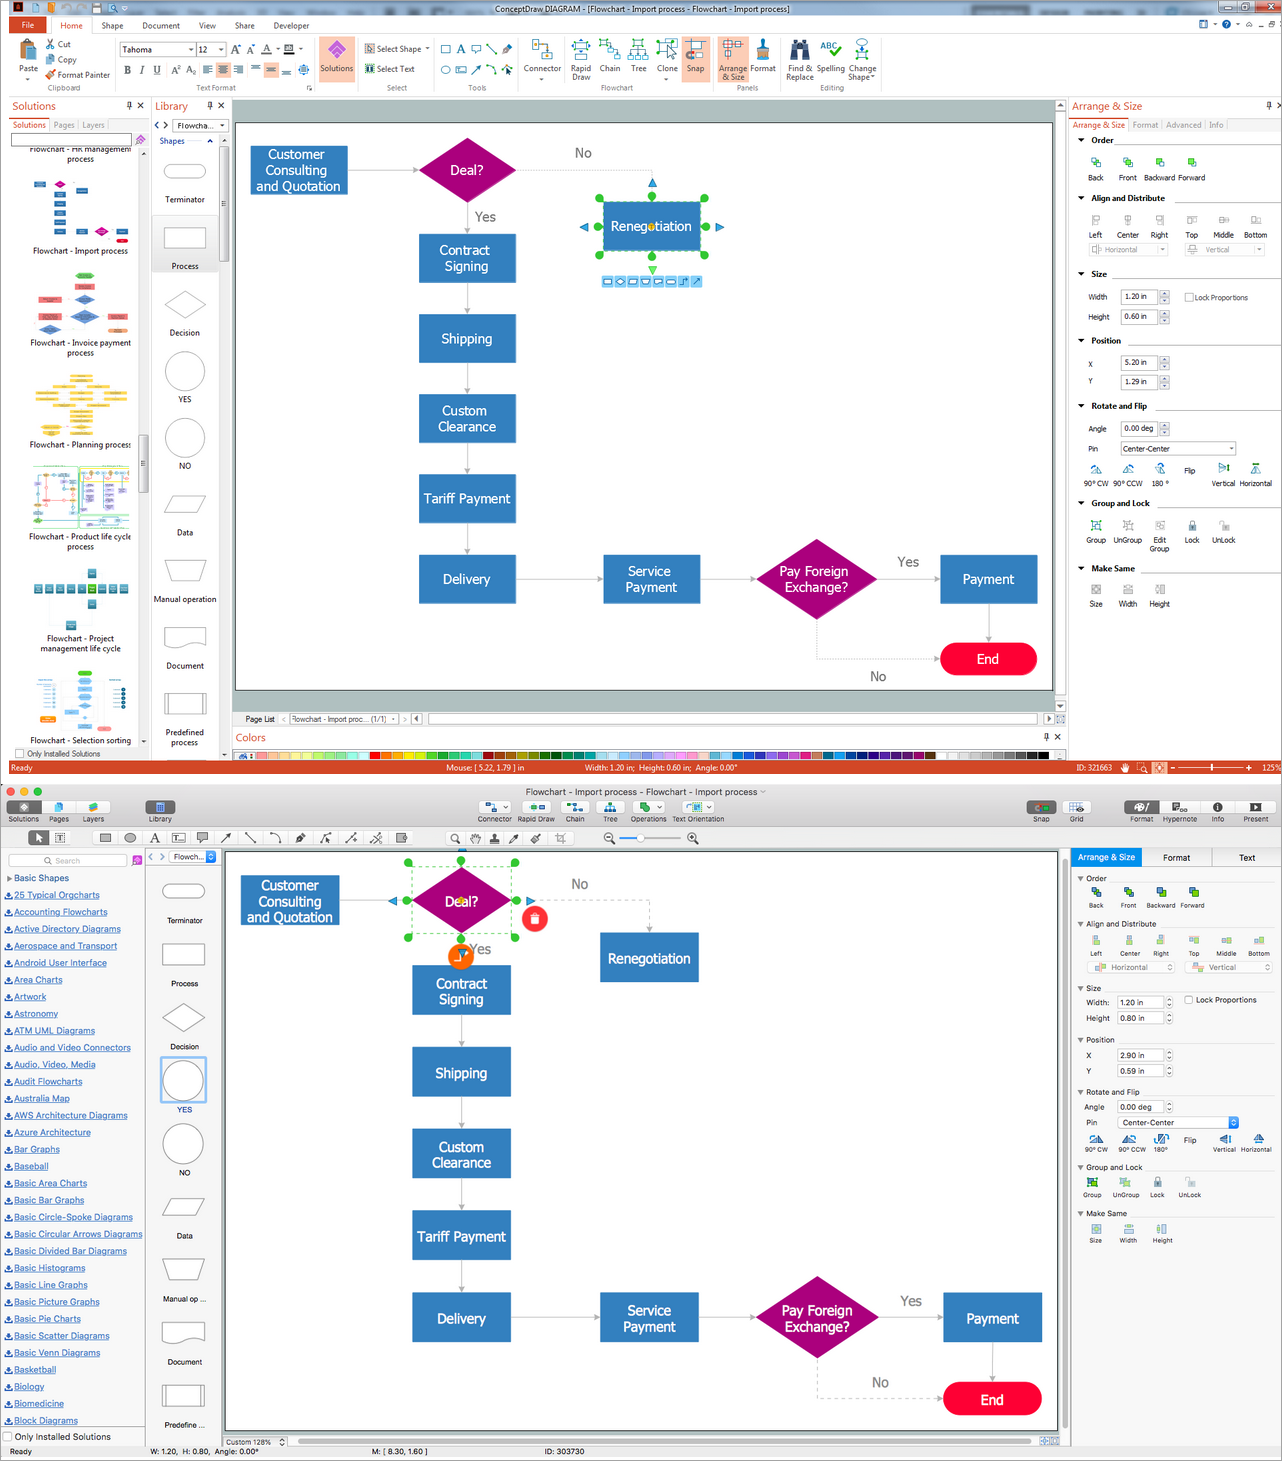
Picture: Basic Diagramming. Flowchart Software
Related Solution:
ConceptDraw DIAGRAM is new software for business and technical drawing. Powerful business drawing tools, extensive libraries with pre-drawn shapes, free samples of business drawings, technical drawings and flowcharts, support of many graphic formats enable users to visually develop their business drawings charts and diagrams in any combination of drawings, diagrams and flow charts.
Picture: ConceptDraw DIAGRAM The best Business Drawing Software
Related Solution:
Drawing an electric circuit plan with all the wiring might seem very complex. If you ever felt afraid to ask how to use electrical and telecom plan software, then it’s time to actually start from altering the templates from the Solution Park. You won’t even notice the moment when you would become an experienced user.
This electrical and telecommunication floor plan plan presents electrical and telecommunication devices located in a country house floor plan. Each electrical or telecom device on this plan is indicated with the particular symbol. Using standard Electrical and Telecommunication symbols makes this floor plan clear for anybody who will be involved into construction process. All the electrical and telecom symbols used in the current floor plan are placed to a legend. This electrical and telecom floor plan can be included as a separate piece into a package of building documentation.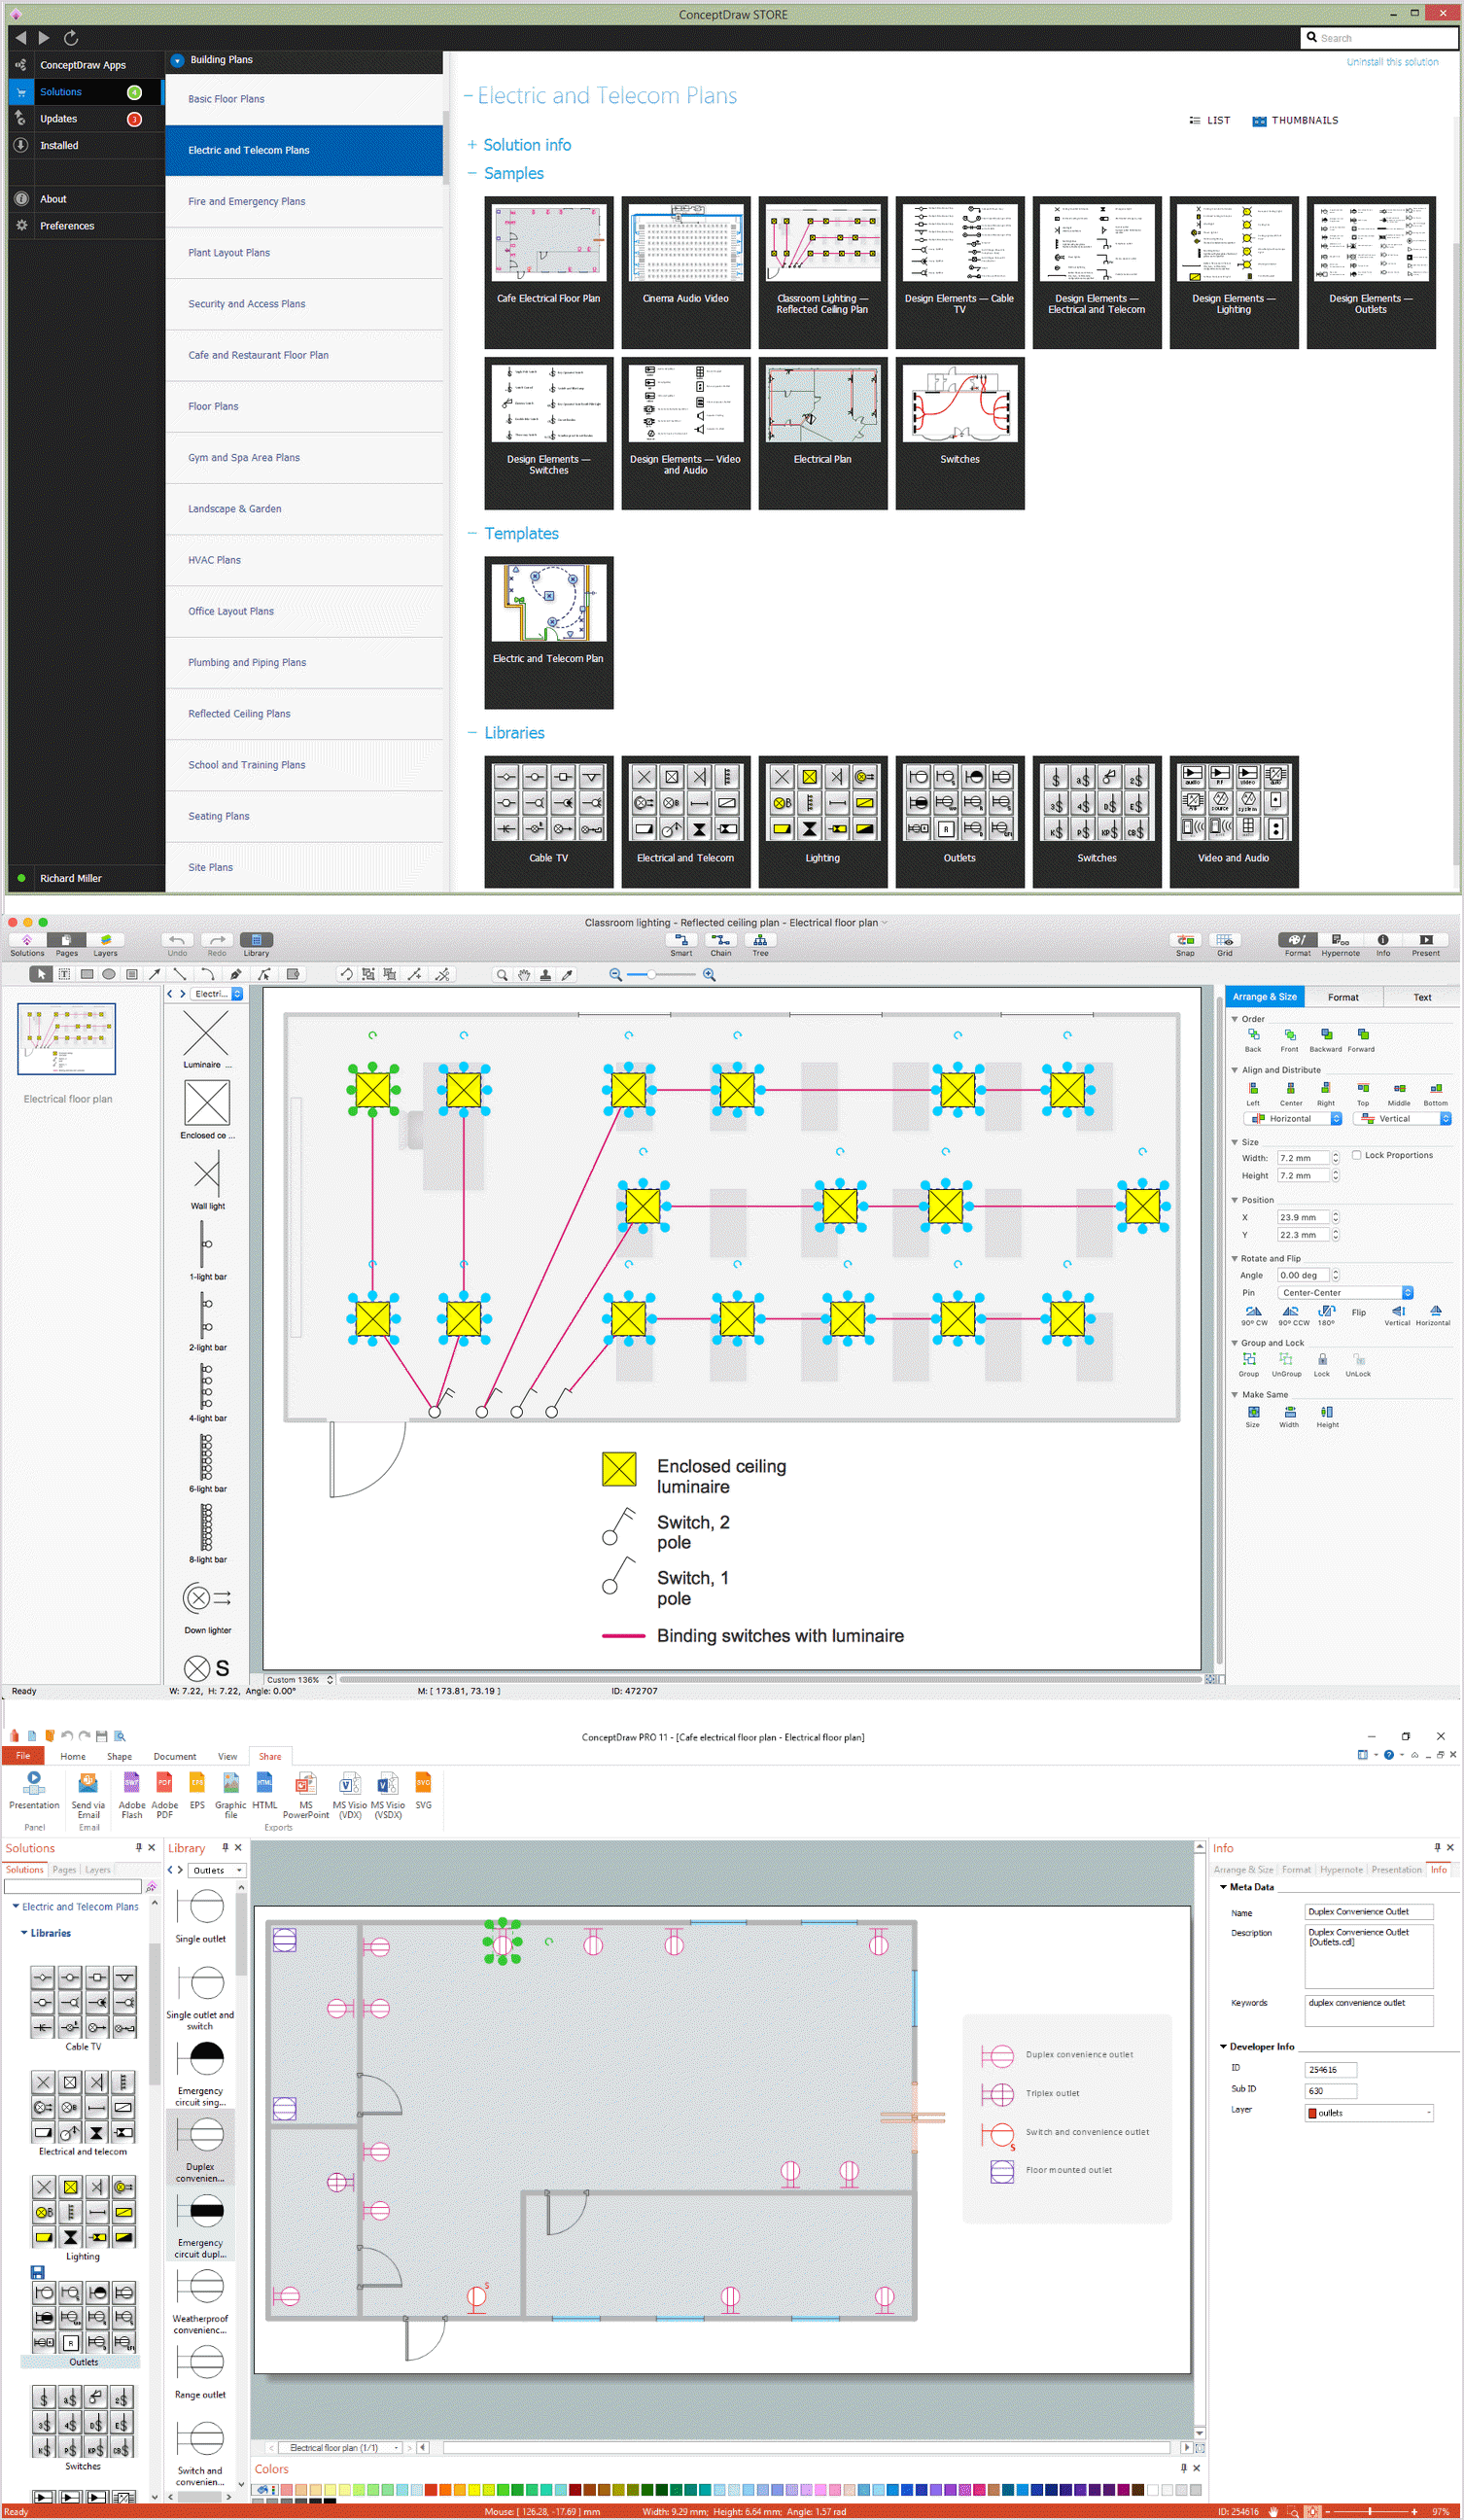
Picture: How To use Electrical and Telecom Plan Software
Related Solution:
Social media is a popular view of mass communication which allows people, companies and organizations create, share, discover, modify, access, comment, discuss and exchange information through the Internet. Social Media Response solution for ConceptDraw DIAGRAM provides collection of 10 libraries with diversity of predesigned vector social media flowchart symbols for fast and easy creating interactive Social Media Flowcharts, Response Charts and Action Mind Maps.
Picture: Social Media Flowchart Symbols
Related Solution:
Use ConceptDraw DIAGRAM software with Flowcharts Solution to create Process Flow Charts, Flow Chart Process Maps, and High-Level Process Flow Charts to illustrate ✔️ high-level processes in industrial, chemical, and process engineering, ✔️ major plant processes, ✔️ minor details
Picture: Process Flow Chart
Related Solution:
Unfortunately, a man can’t predict the future and no one is safe from natural disasters, such as floods, earthquakes, hurricanes or fires. Nonetheless, what you can do to ensure safety for you and your relatives is to create an emergency plan, so everyone will know what to do if emergency happens. Keep that plan simple and train it several times a year so that no one could forget any details of it.
Fire and emergency plans are important to supply people with a visual safety solution. This diagram presents a set of standard symbols used to depict fire safety, emergency, and associated information. Using clear and standard symbols on fire emergency plans provides the coherence of collective actions , helps to avoid embarrassment, and improves communications in an emergent situation. The fire emergency symbols are intended for the general emergency and fire service, as well as for building plans ,engineering drawings and insurance diagrams. They can be used during fire extinguishing and evacuation operations, as well as trainings. It includes vector symbols for emergency management mapping, emergency evacuation diagrams and plans.
Picture: Emergency Plan
Related Solution:
Use samples and templates to describe your own quality processes, brainstorm, and structure quality issues.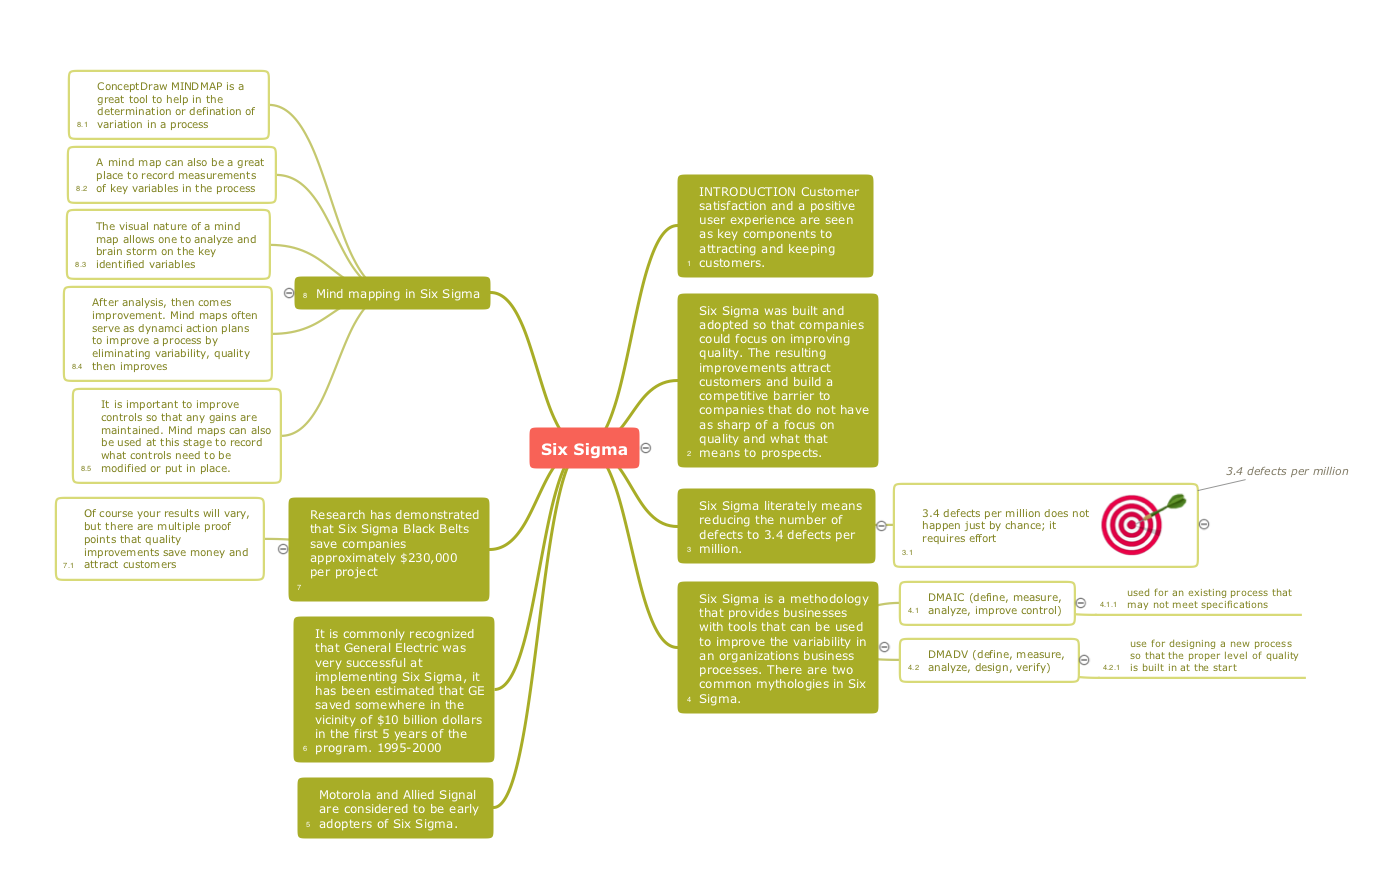
Picture: Quality Mind Maps - samples and templates
Related Solution:
When you are drawing a cross-functional flowchart with ConceptDraw Arrows10 Technology - you get it easily and fast.
ConceptDraw Template library has more than enough versatility to draw any type of diagram with any degree of complexity.
You will get a cross-functional flowchart with basic shapes which can be drawn in minutes, as the result.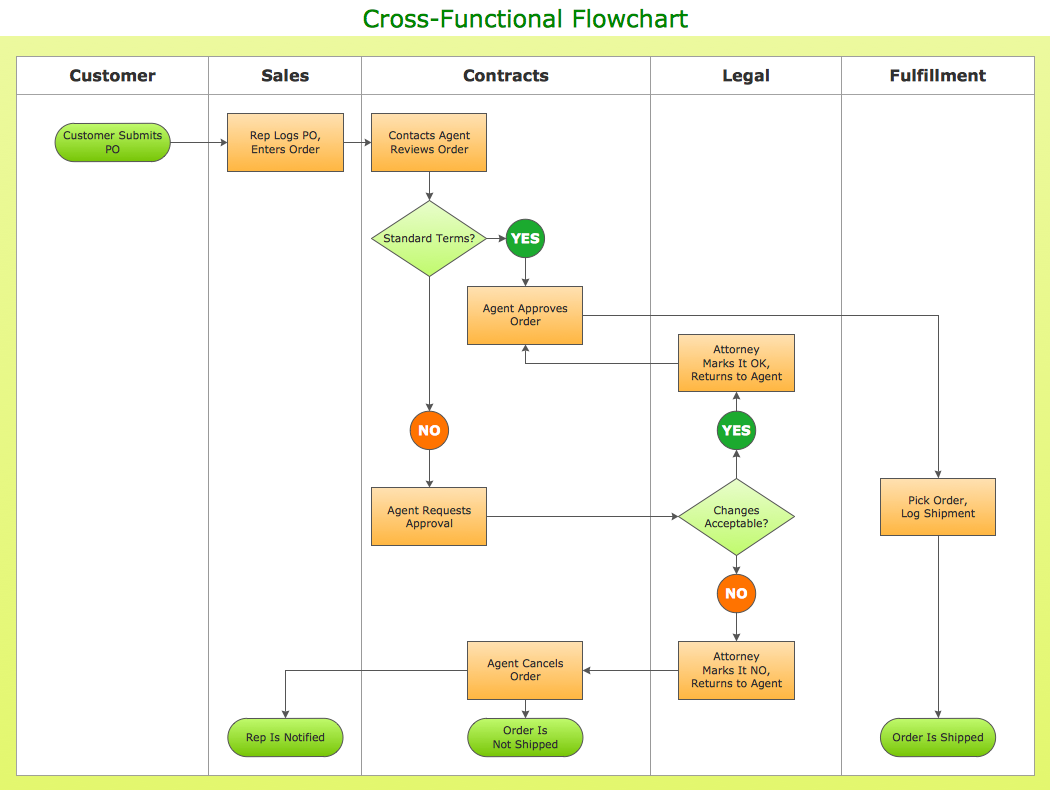
Picture: Cross Functional Flowchart Shapes
The HR Management Software is an incredibly powerful tool for those who need to analyze or present human resource process flows in a visually effective manner.
Picture: HR Management Software
Related Solution:

")
")
