How to Build a Flowchart

Business Process Flowchart Symbols

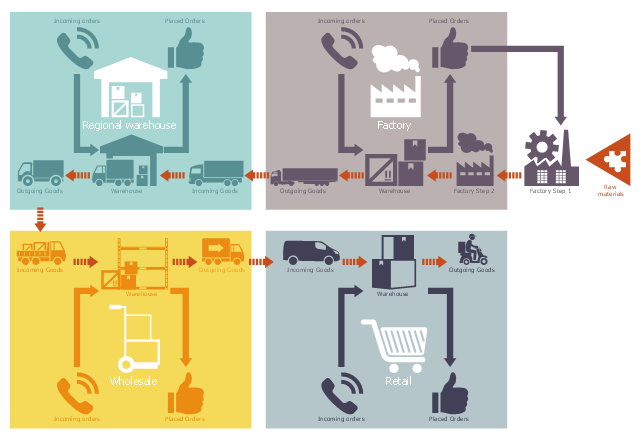
 Logistics Flow Charts
Logistics Flow Charts solution extends ConceptDraw DIAGRAM functionality with opportunities of powerful logistics management software. It provides large collection of predesigned vector logistic symbols, pictograms, objects and clipart to help you design with pleasure Logistics flow chart, Logistics process flow diagram, Inventory flow chart, Warehouse flowchart, Warehouse management flow chart, Inventory control flowchart, or any other Logistics diagram. Use this solution for logistics planning, to reflect logistics activities and processes of an enterprise or firm, to depict the company's supply chains, to demonstrate the ways of enhancing the economic stability on the market, to realize logistics reforms and effective products' promotion.
Process Flow Chart Symbol

Best Program to Create a Flowchart

Work Flow Diagram

Workflow to Make a Purchase. Accounting Flowchart Example

Best Vector Drawing Application for Mac OS X

Work Process

Visual Presentations Made Easy with Diagramming Software


This work flow chart sample was redesigned from the picture "Weather Forecast" from the article "Simulation Workflows".
[iaas.uni-stuttgart.de/ forschung/ projects/ simtech/ sim-workflows.php]
"(1) The weather is predicted for a particular geological area. Hence, the workflow is fed with a model of the geophysical environment of ground, air and water for a requested area.
(2) Over a specified period of time (e.g. 6 hours) several different variables are measured and observed. Ground stations, ships, airplanes, weather balloons, satellites and buoys measure the air pressure, air/ water temperature, wind velocity, air humidity, vertical temperature profiles, cloud velocity, rain fall, and more.
(3) This data needs to be collected from the different sources and stored for later access.
(4) The collected data is analyzed and transformed into a common format (e.g. Fahrenheit to Celsius scale). The normalized values are used to create the current state of the atmosphere.
(5) Then, a numerical weather forecast is made based on mathematical-physical models (e.g. GFS - Global Forecast System, UKMO - United Kingdom MOdel, GME - global model of Deutscher Wetterdienst). The environmental area needs to be discretized beforehand using grid cells. The physical parameters measured in Step 2 are exposed in 3D space as timely function. This leads to a system of partial differential equations reflecting the physical relations that is solved numerically.
(6) The results of the numerical models are complemented with a statistical interpretation (e.g. with MOS - Model-Output-Statistics). That means the forecast result of the numerical models is compared to statistical weather data. Known forecast failures are corrected.
(7) The numerical post-processing is done with DMO (Direct Model Output): the numerical results are interpolated for specific geological locations.
(8) Additionally, a statistical post-processing step removes failures of measuring devices (e.g. using KALMAN filters).
(9) The statistical interpretation and the numerical results are then observed and interpreted by meteorologists based on their subjective experiences.
(10) Finally, the weather forecast is visualized and presented to interested people." [iaas.uni-stuttgart.de/ forschung/ projects/ simtech/ sim-workflows.php]
The example "Workflow diagram - Weather forecast" was drawn using the ConceptDraw PRO diagramming and vector drawing software extended with the Workflow Diagrams solution from the Business Processes area of ConceptDraw Solution Park.
Work flow chart

Best Diagramming Software for macOS


Product Proposal Template

Pyramid Diagram

This work flow chart sample was redesigned from the picture "Simulation for earthquake disaster assessment" from the article "Simulation Workflows".
[iaas.uni-stuttgart.de/ forschung/ projects/ simtech/ sim-workflows.php]
" This simulation was developed to have an in depth understanding of the destructions and the decisions to be made in various phases of crisis management (Source: Mahdi Hashemi and Ali A. Alesheikh (2010). "Developing an agent based simulation model for earthquakes in the context of SDI." GSDI 12 World Conference. 19 – 22 October 2010. Singapour). The simulation process contains following major steps:
(1) All spatial information including satellite images (before and after the earthquake) and topographic/ cadastral maps of the area are mosaicked and georeferenced. The parts of the city that contain various levels of destructions are selected. Three types of features namely buildings, roads and recreational areas are classified and extracted from the satellite images.
(2) The governing factors of destructions are identified; a mathematical model that integrates the factors is constructed.
(3) The simulation is constructed for various parameter values (different earthquake strength, time elapses, etc.)" [iaas.uni-stuttgart.de/ forschung/ projects/ simtech/ sim-workflows.php]
The example "Workflow diagram - Earthquake disaster assessment" was drawn using the ConceptDraw PRO diagramming and vector drawing software extended with the Workflow Diagrams solution from the Business Processes area of ConceptDraw Solution Park.
Work flow chart

How To use Electrical and Telecom Plan Software


Circle Spoke Diagram Template

Circle Diagrams

This logistic flow chart sample shows a board design for the beer distribution game.
It was designed on the base of the Wikimedia Commons file: Beer Distribution Game Board.JPG. [commons.wikimedia.org/ wiki/ File:Beer_ Distribution_ Game_ Board.JPG]
This file is licensed under the Creative Commons Attribution-Share Alike 3.0 Unported license. [creativecommons.org/ licenses/ by-sa/ 3.0/ deed.en]
"The beer distribution game (also known as the beer game) is an experiential learning business simulation game created by a group of professors at MIT Sloan School of Management in early 1960s to demonstrate a number of key principles of supply chain management. The game is played by teams of at least four players, often in heated competition, and takes at least one hour to complete. A debriefing session of roughly equivalent length typically follows to review the results of each team and discuss the lessons involved.
The purpose of the game is to understand the distribution side dynamics of a multi-echelon supply chain used to distribute a single item, in this case, cases of beer." [Beer distribution game. Wikipedia]
The logistic flowchart example "Beer distribution game" was created using ConceptDraw PRO diagramming and vector drawing software extended with the Logistics Flow Charts solution from the Business Processes area of ConceptDraw Solution Park.
Logistic flowchart
The Best Mac Software for Diagramming or Drawing

- Process Flowchart | Types of Flowchart | Model Simulation Flowchart
- In searching of alternative to MS Visio for MAC and PC with ...
- Process Flowchart | Simulation Software For Creating Flowchart
- Earthquake disaster assessment - Workflow diagram | Workflow ...
- Design elements - Audit flowchart | Workflow diagram - Weather ...
- Process Flowchart | IDEF | Schematic Simulation Software
- Telecommunication Network Diagrams | Accounting Flowcharts ...
- SYSML | Workflow Diagrams | Android Simulation Of Flowchart
- Process Flowchart | Steps In Building Simulation Flowchart
- Process Flowchart | ConceptDraw PRO Network Diagram Tool ...