The vector stencils library "Audit flowcharts" contains 31 symbols of audit flow chart diagrams for accounting, financial management, fiscal information tracking, money management, decision flowcharts, and financial inventories.
"A financial audit, or more accurately, an audit of financial statements, is the verification of the financial statements of a legal entity, with a view to express an audit opinion. The audit opinion is intended to provide reasonable assurance, but not absolute assurance, that the financial statements are presented fairly, in all material respects, and/ or give a true and fair view in accordance with the financial reporting framework. The purpose of an audit is to provide an objective independent examination of the financial statements, which increases the value and credibility of the financial statements produced by management, thus increase user confidence in the financial statement, reduce investor risk and consequently reduce the cost of capital of the preparer of the financial statements. ...
Financial audits are typically performed by firms of practicing accountants who are experts in financial reporting. The financial audit is one of many assurance functions provided by accounting firms. Many organizations separately employ or hire internal auditors, who do not attest to financial reports but focus mainly on the internal controls of the organization. External auditors may choose to place limited reliance on the work of internal auditors. Auditing promotes transparency and accuracy in the financial disclosures made by an organization, therefore would likely to reduce of such corporations to conceal unscrupulous dealings.
Internationally, the International Standards on Auditing (ISA) issued by the International Auditing and Assurance Standards Board (IAASB) is considered as the benchmark for audit process. Almost all jurisdictions require auditors to follow the ISA or a local variation of the ISA." [Financial audit. Wikipedia]
The example "Design elements - Audit flowchart" was created using the ConceptDraw PRO diagramming and vector drawing software extended with the Audit Flowcharts solution from the Finance and Accounting area of ConceptDraw Solution Park.
Audit flowchart symbols

This work flow chart sample was redesigned from the picture "Weather Forecast" from the article "Simulation Workflows".
[iaas.uni-stuttgart.de/ forschung/ projects/ simtech/ sim-workflows.php]
"(1) The weather is predicted for a particular geological area. Hence, the workflow is fed with a model of the geophysical environment of ground, air and water for a requested area.
(2) Over a specified period of time (e.g. 6 hours) several different variables are measured and observed. Ground stations, ships, airplanes, weather balloons, satellites and buoys measure the air pressure, air/ water temperature, wind velocity, air humidity, vertical temperature profiles, cloud velocity, rain fall, and more.
(3) This data needs to be collected from the different sources and stored for later access.
(4) The collected data is analyzed and transformed into a common format (e.g. Fahrenheit to Celsius scale). The normalized values are used to create the current state of the atmosphere.
(5) Then, a numerical weather forecast is made based on mathematical-physical models (e.g. GFS - Global Forecast System, UKMO - United Kingdom MOdel, GME - global model of Deutscher Wetterdienst). The environmental area needs to be discretized beforehand using grid cells. The physical parameters measured in Step 2 are exposed in 3D space as timely function. This leads to a system of partial differential equations reflecting the physical relations that is solved numerically.
(6) The results of the numerical models are complemented with a statistical interpretation (e.g. with MOS - Model-Output-Statistics). That means the forecast result of the numerical models is compared to statistical weather data. Known forecast failures are corrected.
(7) The numerical post-processing is done with DMO (Direct Model Output): the numerical results are interpolated for specific geological locations.
(8) Additionally, a statistical post-processing step removes failures of measuring devices (e.g. using KALMAN filters).
(9) The statistical interpretation and the numerical results are then observed and interpreted by meteorologists based on their subjective experiences.
(10) Finally, the weather forecast is visualized and presented to interested people." [iaas.uni-stuttgart.de/ forschung/ projects/ simtech/ sim-workflows.php]
The example "Workflow diagram - Weather forecast" was drawn using the ConceptDraw PRO diagramming and vector drawing software extended with the Workflow Diagrams solution from the Business Processes area of ConceptDraw Solution Park.
Work flow chart

SDL Flowchart Symbols

LLNL Flow Charts
.jpg "LLNL flow charts")
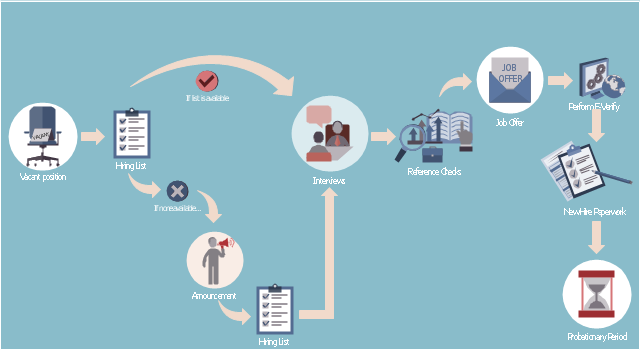
This HR infographics example was designed on the base of flowchart "Hiring Process" from the website of the Idaho Division of Human Resources.
"... hiring process flowchart outlining the steps to fill a vacant position." [dhr.idaho.gov/ hiringprocess.html]
"What is a hiring list and what are they for?
A hiring list consists of applicants who completed and passed the examination for a vacant classified position.
The applicants are ranked on the hiring list in order from highest to lowest score." [dhr.idaho.gov/ PDF%20 documents/ Flowchart/ Hiring%20 List%20 Guidance.pdf]
"Announcements.
Announcing a vacant position benefits the agency by allowing a wide array of applicants the opportunity to compete for job openings, resulting in a more qualified employee. The State Merit System requires all appointments, promotions and separations in the classified service to be based on competence, valid job requirements, and individual performance." [dhr.idaho.gov/ PDF%20 documents/ Flowchart/ Announcement.pdf]
"Conducting A Lawful Employment Interview.
Interviewing prospective employees is one of the most important activities employers do. The employer’s objective of an interview is to determine whether an applicant is suitable for an available position. The interview provides the employer an opportunity to obtain in-depth information about a job applicant’s skills, work history, and employment background for this purpose." [dhr.idaho.gov/ PDF%20 documents/ Flowchart/ Conducting%20 a%20 Lawful%20 Employment%20 Interview.pdf]
"Reference Checks.
References should be checked after a successful interview with a candidate, but before you offer them the position. If after interviewing there are several candidates that are qualified for the position, reference checks are also a way to further distinguish who might best fit within your agency." [dhr.idaho.gov/ PDF%20 documents/ Flowchart/ Reference%20 Checks.pdf]
"Making the job offer.
Before offering the position to your selected candidate, be sure to speak with your HR and fiscal staff. They may have some suggestions for negotiating the starting salary, etc.
Job Offer Letter.
... A job offer letter should be given to the newly hired employee after you have verbally negotiated the terms of employment. This letter confirms the conditions of employment the selected candidate has accepted and gives them information for their first day." [dhr.idaho.gov/ PDF%20 documents/ Flowchart/ Making%20 the%20 job%20 offer.pdf]
"E-verify.
To ensure compliance with the Governor’s Executive Order 2009-10, all
State Agencies are encouraged to participate in E-verify.
E-verify is an internet based system that allows an employer, using information reported on an employee’s Form I-9, to determine the eligibility of that employee to work in the United States.
The E-Verify system is operated by the U.S. Department of Homeland Security in partnership with the Social Security Administration and its use is free of charge to employers." [dhr.idaho.gov/ PDF%20 documents/ Flowchart/ EVerify%20 Statement.pdf]
"New Hire Paperwork.
There are several important forms for the new employee to fill out." [dhr.idaho.gov/ PDF%20 documents/ Flowchart/ New%20 Hire%20 Paperwork.pdf]
"Probationary Period.
All appointments and promotions into classified positions require a probationary period of 1,040 hours
except for peace officers who must serve 2,080 hours.
The probationary period is a working test period to evaluate the work performance of the employee and to determine their suitability for the position." [dhr.idaho.gov/ PDF%20 documents/ Flowchart/ Probationary%20 Period%20 for%20 Hiring%20 Process.pdf]
The HR infographics example "Hiring process workflow" was created using the ConceptDraw PRO diagramming and vector drawing software extended with the HR Flowcharts solution from the Management area of ConceptDraw Solution Park.
HR infographics
This work flow chart sample was redesigned from the picture "Simulation for earthquake disaster assessment" from the article "Simulation Workflows".
[iaas.uni-stuttgart.de/ forschung/ projects/ simtech/ sim-workflows.php]
" This simulation was developed to have an in depth understanding of the destructions and the decisions to be made in various phases of crisis management (Source: Mahdi Hashemi and Ali A. Alesheikh (2010). "Developing an agent based simulation model for earthquakes in the context of SDI." GSDI 12 World Conference. 19 – 22 October 2010. Singapour). The simulation process contains following major steps:
(1) All spatial information including satellite images (before and after the earthquake) and topographic/ cadastral maps of the area are mosaicked and georeferenced. The parts of the city that contain various levels of destructions are selected. Three types of features namely buildings, roads and recreational areas are classified and extracted from the satellite images.
(2) The governing factors of destructions are identified; a mathematical model that integrates the factors is constructed.
(3) The simulation is constructed for various parameter values (different earthquake strength, time elapses, etc.)" [iaas.uni-stuttgart.de/ forschung/ projects/ simtech/ sim-workflows.php]
The example "Workflow diagram - Earthquake disaster assessment" was drawn using the ConceptDraw PRO diagramming and vector drawing software extended with the Workflow Diagrams solution from the Business Processes area of ConceptDraw Solution Park.
Work flow chart

This work flow chart sample was redesigned from the picture "Weather Forecast" from the article "Simulation Workflows".
[iaas.uni-stuttgart.de/ forschung/ projects/ simtech/ sim-workflows.php]
"(1) The weather is predicted for a particular geological area. Hence, the workflow is fed with a model of the geophysical environment of ground, air and water for a requested area.
(2) Over a specified period of time (e.g. 6 hours) several different variables are measured and observed. Ground stations, ships, airplanes, weather balloons, satellites and buoys measure the air pressure, air/ water temperature, wind velocity, air humidity, vertical temperature profiles, cloud velocity, rain fall, and more.
(3) This data needs to be collected from the different sources and stored for later access.
(4) The collected data is analyzed and transformed into a common format (e.g. Fahrenheit to Celsius scale). The normalized values are used to create the current state of the atmosphere.
(5) Then, a numerical weather forecast is made based on mathematical-physical models (e.g. GFS - Global Forecast System, UKMO - United Kingdom MOdel, GME - global model of Deutscher Wetterdienst). The environmental area needs to be discretized beforehand using grid cells. The physical parameters measured in Step 2 are exposed in 3D space as timely function. This leads to a system of partial differential equations reflecting the physical relations that is solved numerically.
(6) The results of the numerical models are complemented with a statistical interpretation (e.g. with MOS - Model-Output-Statistics). That means the forecast result of the numerical models is compared to statistical weather data. Known forecast failures are corrected.
(7) The numerical post-processing is done with DMO (Direct Model Output): the numerical results are interpolated for specific geological locations.
(8) Additionally, a statistical post-processing step removes failures of measuring devices (e.g. using KALMAN filters).
(9) The statistical interpretation and the numerical results are then observed and interpreted by meteorologists based on their subjective experiences.
(10) Finally, the weather forecast is visualized and presented to interested people." [iaas.uni-stuttgart.de/ forschung/ projects/ simtech/ sim-workflows.php]
The example "Workflow diagram - Weather forecast" was drawn using the ConceptDraw PRO diagramming and vector drawing software extended with the Workflow Diagrams solution from the Business Processes area of ConceptDraw Solution Park.
[iaas.uni-stuttgart.de/ forschung/ projects/ simtech/ sim-workflows.php]
"(1) The weather is predicted for a particular geological area. Hence, the workflow is fed with a model of the geophysical environment of ground, air and water for a requested area.
(2) Over a specified period of time (e.g. 6 hours) several different variables are measured and observed. Ground stations, ships, airplanes, weather balloons, satellites and buoys measure the air pressure, air/ water temperature, wind velocity, air humidity, vertical temperature profiles, cloud velocity, rain fall, and more.
(3) This data needs to be collected from the different sources and stored for later access.
(4) The collected data is analyzed and transformed into a common format (e.g. Fahrenheit to Celsius scale). The normalized values are used to create the current state of the atmosphere.
(5) Then, a numerical weather forecast is made based on mathematical-physical models (e.g. GFS - Global Forecast System, UKMO - United Kingdom MOdel, GME - global model of Deutscher Wetterdienst). The environmental area needs to be discretized beforehand using grid cells. The physical parameters measured in Step 2 are exposed in 3D space as timely function. This leads to a system of partial differential equations reflecting the physical relations that is solved numerically.
(6) The results of the numerical models are complemented with a statistical interpretation (e.g. with MOS - Model-Output-Statistics). That means the forecast result of the numerical models is compared to statistical weather data. Known forecast failures are corrected.
(7) The numerical post-processing is done with DMO (Direct Model Output): the numerical results are interpolated for specific geological locations.
(8) Additionally, a statistical post-processing step removes failures of measuring devices (e.g. using KALMAN filters).
(9) The statistical interpretation and the numerical results are then observed and interpreted by meteorologists based on their subjective experiences.
(10) Finally, the weather forecast is visualized and presented to interested people." [iaas.uni-stuttgart.de/ forschung/ projects/ simtech/ sim-workflows.php]
The example "Workflow diagram - Weather forecast" was drawn using the ConceptDraw PRO diagramming and vector drawing software extended with the Workflow Diagrams solution from the Business Processes area of ConceptDraw Solution Park.
Work flow chart
IDEF0 standard with ConceptDraw PRO

According to the IDEF0 standard any process can be described in the form of a block (Activity Box) which has inputs and outputs. The process consists in transformation of inputs into outputs under the influence of the management and in the presence of necessary resources. Outputs of the given process later on can be either inputs for the next process or resources, or management means.
- About Sand Work Image Chart
- Basic Flowchart Symbols and Meaning | Flowchart design ...
- Flowchart Marketing Process. Flowchart Examples | Sales Process ...
- Import process - Flowchart | How to Import Project Data From MS ...
- Sales Process Flowchart . Flowchart Examples | Sales Process Steps ...
- Property Management Examples | Land sales process flowchart ...
- Flowchart design. Flowchart symbols, shapes, stencils and icons ...
- Work Flow Chart Template
- Accounting Flowchart : Purchasing, Receiving, Payable and Payment
- Workflow to Make a Purchase. Accounting Flowchart Example ...
- Flow chart Example. Warehouse Flowchart | Design elements ...
- Workflow to Make a Purchase. Accounting Flowchart Example ...
- Block diagram - Selling technology patent process | Sales Process ...
- Purchasing Flowchart - Purchase Order. Flowchart Examples ...
- Sales Process Flowchart . Flowchart Examples | Block diagram ...
- How to Create a HR Process Flowchart Using ConceptDraw PRO ...
- Order processing - Opportunity flowchart | Replacing engine oil ...
- Tqm Flowchart Example
- Basic Flowchart Symbols and Meaning | Flowchart Symbols ...