 Telecommunication Network Diagrams
Telecommunication Network Diagrams solution extends ConceptDraw DIAGRAM software with samples, templates, and great collection of vector stencils to help the specialists in a field of networks and telecommunications, as well as other users to create Computer systems networking and Telecommunication network diagrams for various fields, to organize the work of call centers, to design the GPRS networks and GPS navigational systems, mobile, satellite and hybrid communication networks, to construct the mobile TV networks and wireless broadband networks.
 Accounting Flowcharts
Accounting Flowcharts solution extends ConceptDraw DIAGRAM software with templates, samples and library of vector stencils for drawing the accounting flow charts.
 Active Directory Diagrams
Active Directory Diagrams solution significantly extends the capabilities of ConceptDraw DIAGRAM software with special Active Directory samples, convenient template and libraries of Active Directory vector stencils, common icons of sites and services, icons of LDPA elements, which were developed to help you in planning and modelling network structures and network topologies, in designing excellently looking Active Directory diagrams, Active Directory Structure diagrams, and Active Directory Services diagram, which are perfect way to visualize detailed structures of Microsoft Windows networks, Active Directory Domain topology, Active Directory Site topology, Organizational Units (OU), and Exchange Server organization.
Data Modeling with Entity Relationship Diagram

 Logistics Flow Charts
Logistics Flow Charts solution extends ConceptDraw DIAGRAM functionality with opportunities of powerful logistics management software. It provides large collection of predesigned vector logistic symbols, pictograms, objects and clipart to help you design with pleasure Logistics flow chart, Logistics process flow diagram, Inventory flow chart, Warehouse flowchart, Warehouse management flow chart, Inventory control flowchart, or any other Logistics diagram. Use this solution for logistics planning, to reflect logistics activities and processes of an enterprise or firm, to depict the company's supply chains, to demonstrate the ways of enhancing the economic stability on the market, to realize logistics reforms and effective products' promotion.
Data Flow Diagram Software

 IDEF Business Process Diagrams
The IDEF Business Process Diagrams solution can help the ConceptDraw DIAGRAM users create the needed IDEF business process diagrams by providing them with useful drawing tools, the stencils meaning the design symbols including the connectors, IDEF design elements. These tools help users to create the great looking business process diagrams based on the IDEF methodology, effective database designs and object-oriented designs, following the integration definition methodology. Being suitable for any user who needs to capture or to record different business processes and the system architecture, IDEF Business Process Diagrams solution is useful for many IT specialists, computer specialists, network and telecommunication engineers, IT managers, software engineers, system administrators, webmasters, system architects, and system engineers, etc.
This work flow chart sample was redesigned from the picture "Weather Forecast" from the article "Simulation Workflows".
[iaas.uni-stuttgart.de/ forschung/ projects/ simtech/ sim-workflows.php]
"(1) The weather is predicted for a particular geological area. Hence, the workflow is fed with a model of the geophysical environment of ground, air and water for a requested area.
(2) Over a specified period of time (e.g. 6 hours) several different variables are measured and observed. Ground stations, ships, airplanes, weather balloons, satellites and buoys measure the air pressure, air/ water temperature, wind velocity, air humidity, vertical temperature profiles, cloud velocity, rain fall, and more.
(3) This data needs to be collected from the different sources and stored for later access.
(4) The collected data is analyzed and transformed into a common format (e.g. Fahrenheit to Celsius scale). The normalized values are used to create the current state of the atmosphere.
(5) Then, a numerical weather forecast is made based on mathematical-physical models (e.g. GFS - Global Forecast System, UKMO - United Kingdom MOdel, GME - global model of Deutscher Wetterdienst). The environmental area needs to be discretized beforehand using grid cells. The physical parameters measured in Step 2 are exposed in 3D space as timely function. This leads to a system of partial differential equations reflecting the physical relations that is solved numerically.
(6) The results of the numerical models are complemented with a statistical interpretation (e.g. with MOS - Model-Output-Statistics). That means the forecast result of the numerical models is compared to statistical weather data. Known forecast failures are corrected.
(7) The numerical post-processing is done with DMO (Direct Model Output): the numerical results are interpolated for specific geological locations.
(8) Additionally, a statistical post-processing step removes failures of measuring devices (e.g. using KALMAN filters).
(9) The statistical interpretation and the numerical results are then observed and interpreted by meteorologists based on their subjective experiences.
(10) Finally, the weather forecast is visualized and presented to interested people." [iaas.uni-stuttgart.de/ forschung/ projects/ simtech/ sim-workflows.php]
The example "Workflow diagram - Weather forecast" was drawn using the ConceptDraw PRO diagramming and vector drawing software extended with the Workflow Diagrams solution from the Business Processes area of ConceptDraw Solution Park.
Work flow chart

Process Flow Chart Examples

How to Build Cloud Computing Diagram Principal Cloud Manufacturing

Work Flow Diagram

JSD - Jackson system development

Software Work Flow Process in Project Management with Diagram

This sample shows the Workflow Diagram that clearly illustrates stages a BPM consists of and relations between all parts of business. The Workflow Diagrams are used to represent the transferring of data during the work process, to study and analysis the working processes, and to optimize a workflow.
Pyramid Diagram

 Workflow Diagrams
Evaluate all advantages of workflow diagram software ConceptDraw DIAGRAM extended with the Workflow Diagrams solution that includes workflow examples and samples, workflow diagram template, a library of workflow diagram symbols and pictorial vector clipart for drawing visual and intuitively understandable Workflow diagrams. Design pictorial Work flow chart or Work flow diagram easier than ever, use them for documentation and implementation purposes, export in a variety of common graphics formats and share with colleagues. Extend the already wide area Work flow diagrams' applications that are used today in the manufacturing industry, software development, HR, medicine, banking and finance sphere, education, military, government, business, e-commerce, and many other fields.
 Block Diagrams
Block Diagrams solution with the pre-made templates, samples and stencil libraries full of vector elements can be used for drawing any needed Block diagram, Functional block diagram, or Block flow diagram. Using the created block diagrams for visualizing the high-levelled concepts of engineering, software system design and business, any business owner has a chance to succeed in doing what he is meant to. Many business specialists, business owners, and project managers will find the ConceptDraw DIAGRAM block diagram creator with Block Diagrams solution useful for drawing the 2D and 3D Block diagrams as using the pre-designed objects.
Types of Flowchart — Overview


 SYSML
SYSML
In order to make a SysML-related drawing, the ConceptDraw DIAGRAM charting and drawing software can be used. Also, the SysML solution can be found as an extension to the ConceptDraw DIAGRAM application, enabling all those with systems engineering background to use the offered tools for creating the needed systems process models in order to use in the professional documentation for either distribution or analysis. Offering the vector stencil libraries full of the icons that may relate to each of the 9 official diagrams used in SysML, the SysML solution is useful for many system engineers.
Swim Lane Flowchart Symbols

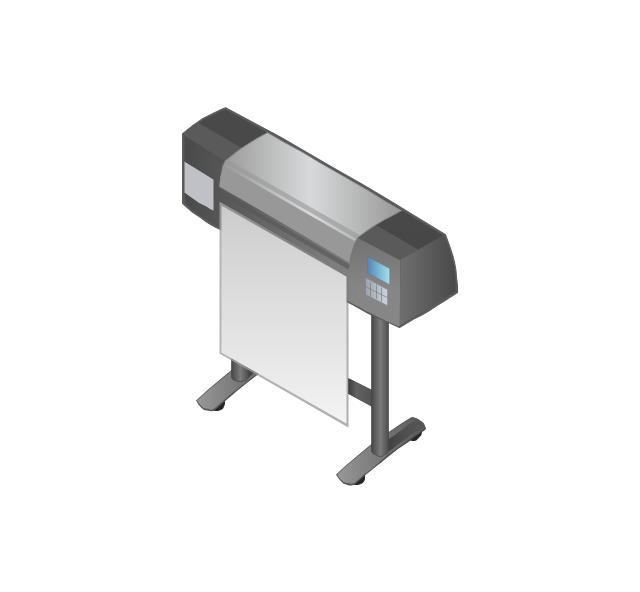
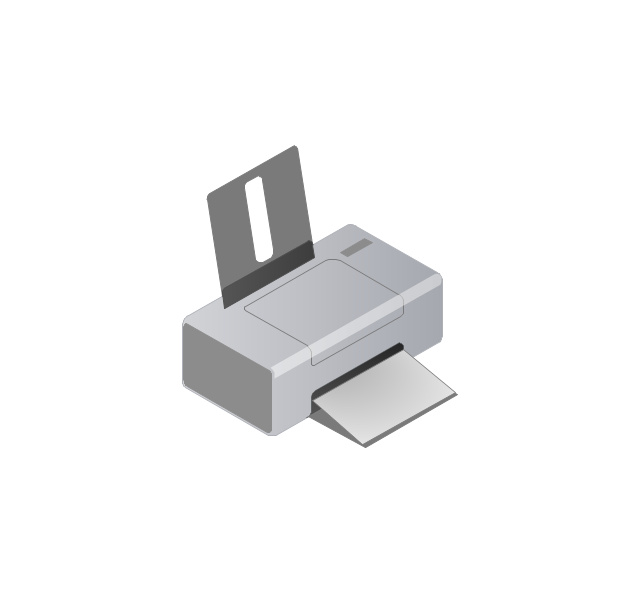
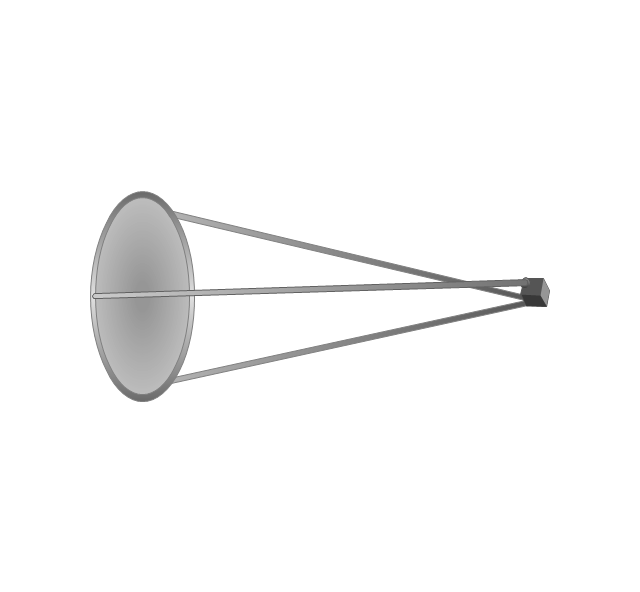
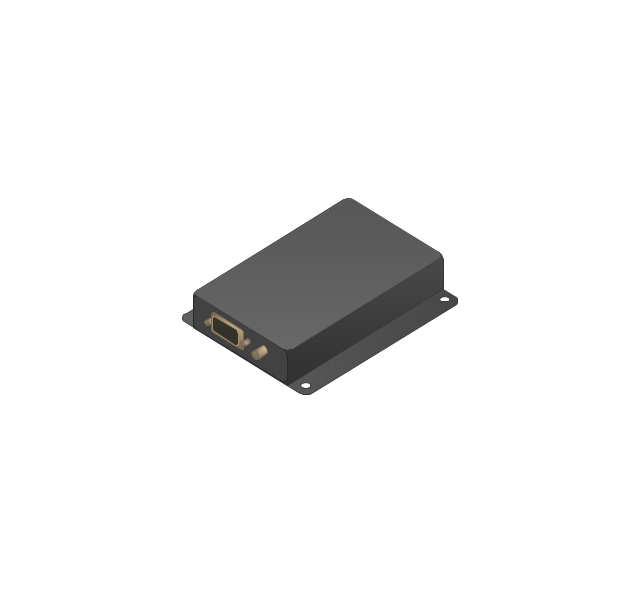
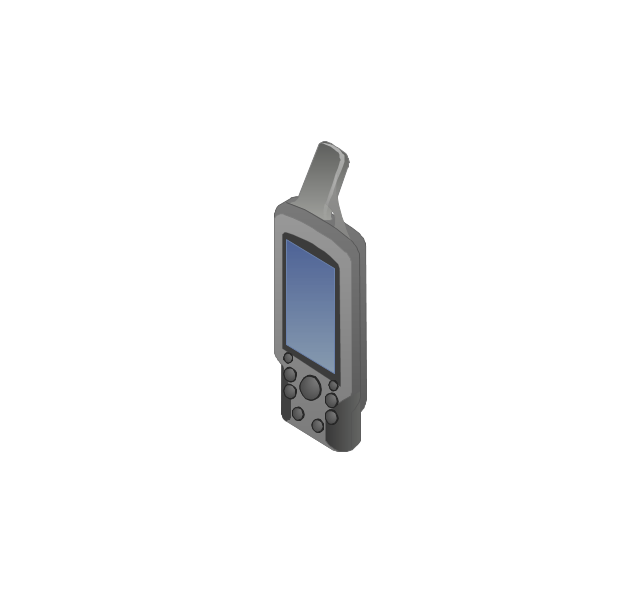
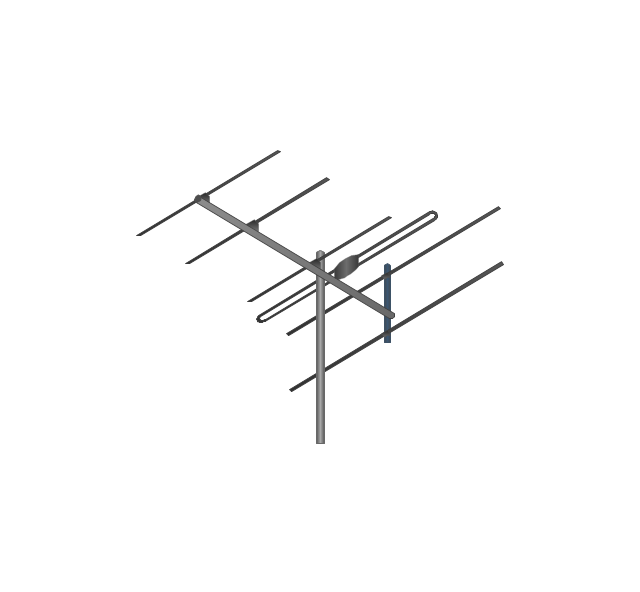
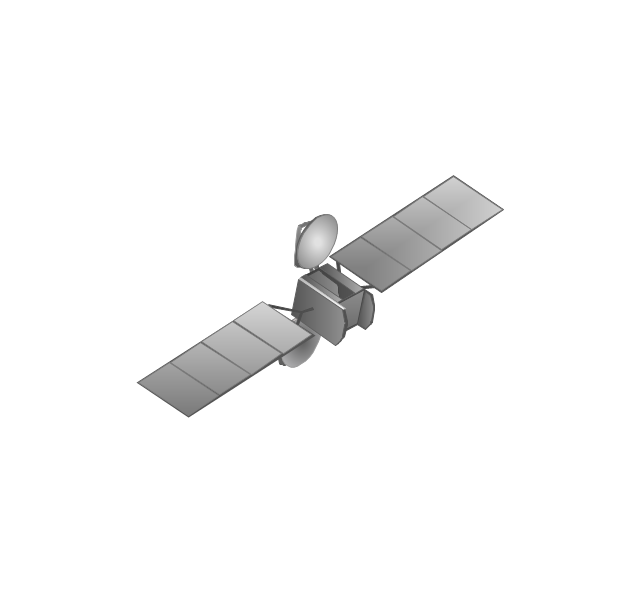
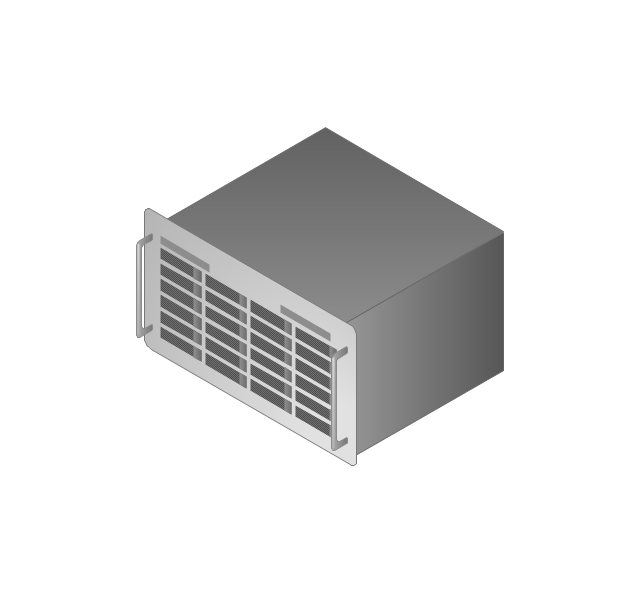
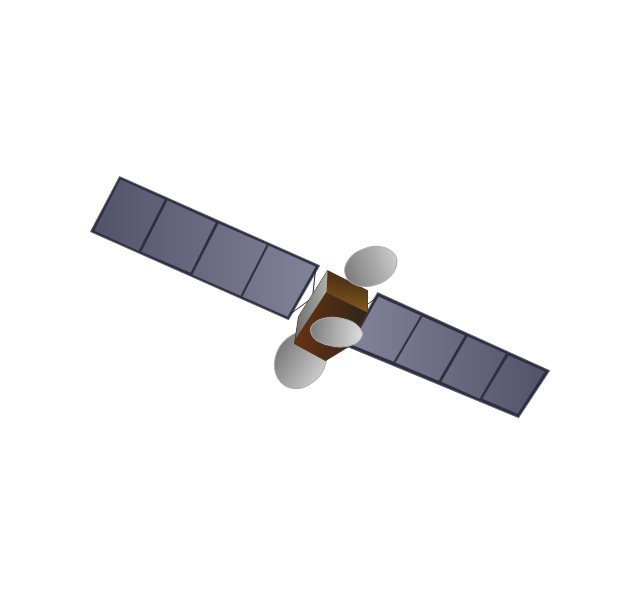
The vector stencils library "Computers and network isometric" contains 56 3D clipart images of computer and network devices and equipment for drawing network diagrams.
The clip art example "Computers and network isometric - Vector stencils library" was created using the ConceptDraw PRO diagramming and vector drawing software extended with the Computer and Networks solution from the Computer and Networks area of ConceptDraw Solution Park.
The clip art example "Computers and network isometric - Vector stencils library" was created using the ConceptDraw PRO diagramming and vector drawing software extended with the Computer and Networks solution from the Computer and Networks area of ConceptDraw Solution Park.
Laptop

DDCS

Server
Webcam

Wireless Network Storage
Personal computer

VoIP phone
Fax
Plotter
Mobile phone
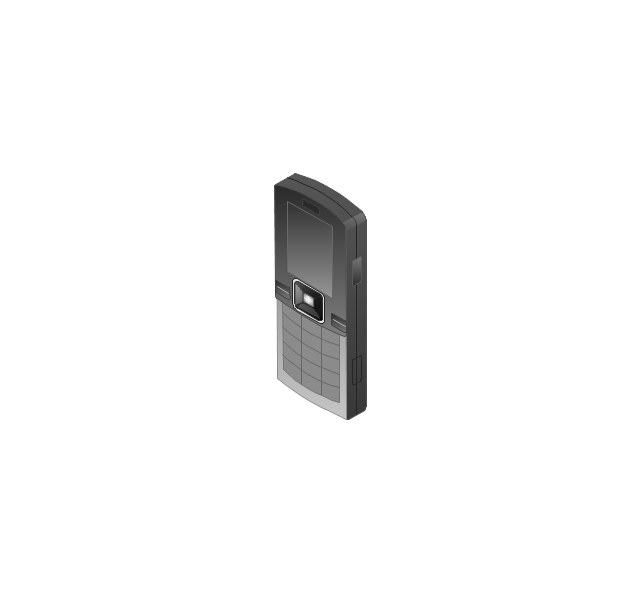
Feature phone

Printer
Satellite dish

Satellite antenna
Automatic-tracking satellite dish
Wireless access point
Wireless router

Router
Network switch
Network device
Mobile GPS Terminal
GPS phone
Television antenna
Radio tower

Base station

Satellite
In-vehicle satellite telecommunication

Satellite dishes on ship

Airplane

Internet

Man

Woman

Call-center

Honeycomb

Mountain

Radio waves

Radio waves

Tower block
Office building
House

House

Globe

Wireless security camera
Truck
Tree

Conifer tree

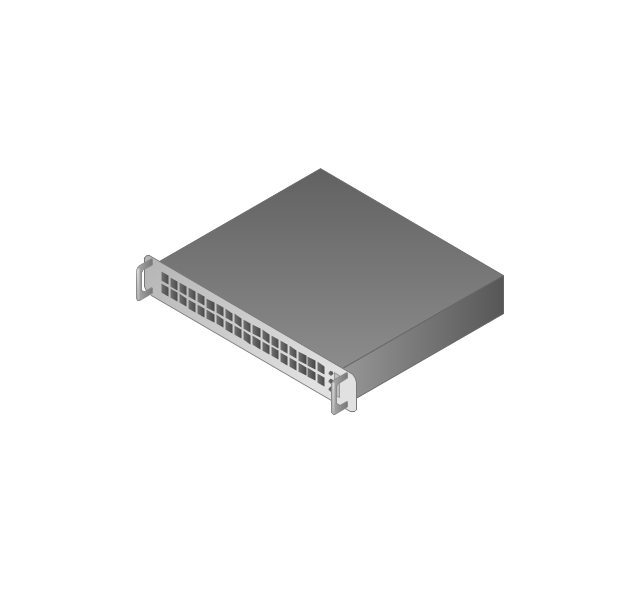
1U hub / switch
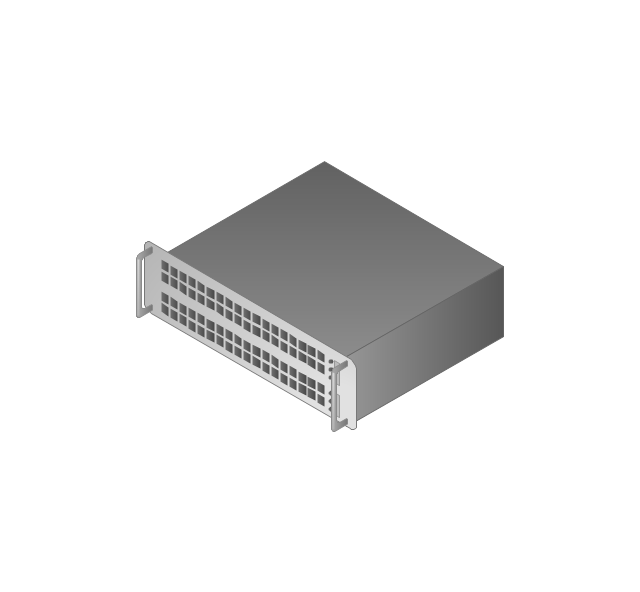
2U hub / switch
1U server

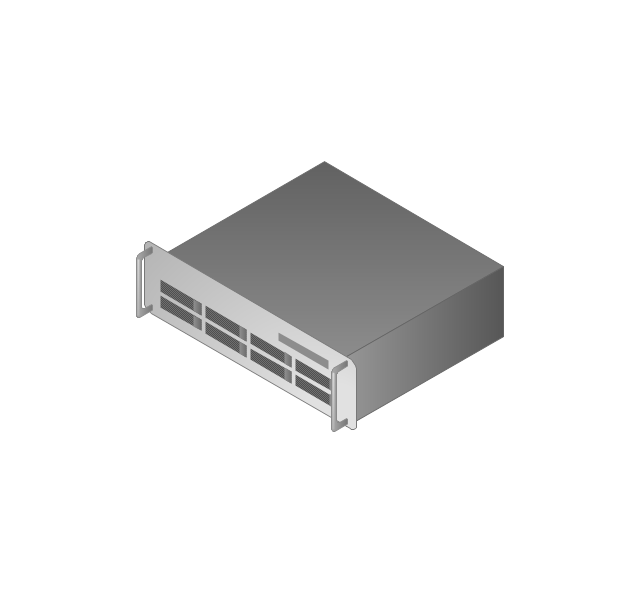
2U Server
3U Server
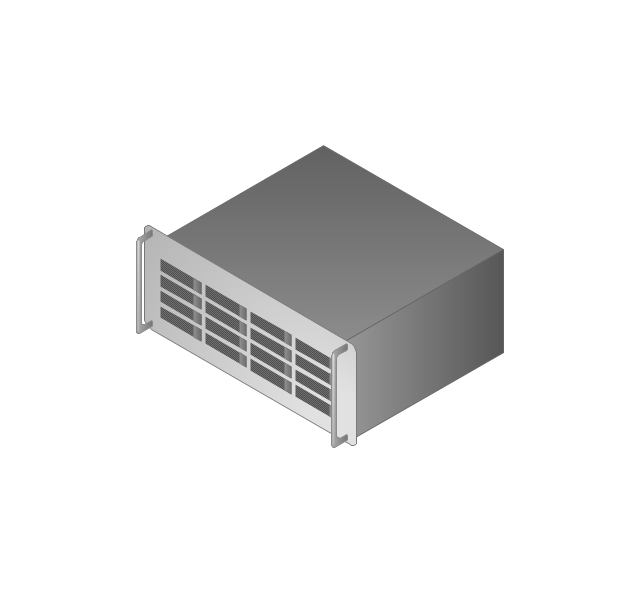
4U Server
Communications satellite
Car

Radio waves

Firewall

- Process Flowchart | IDEF | Schematic Simulation Software
- Process Flowchart | Simulation Software For Creating Flowchart
- Process Flowchart | Electrical Simulation Software - Conceptdraw.com
- Network Layout Floor Plans | Flowchart Simulation In Android App
- Computer Network Diagrams | 5 Level pyramid model diagram ...
- Process Flowchart | Steps In Building Simulation Flowchart
- Earthquake disaster assessment - Workflow diagram | Workflow ...
- Earthquake disaster assessment | Network Diagram Software
- Earthquake disaster assessment | Computer network
- Workflow diagram | Telecommunications Networks | Satellite Flowchart