This work flow chart sample was redesigned from the picture "Weather Forecast" from the article "Simulation Workflows".
[iaas.uni-stuttgart.de/ forschung/ projects/ simtech/ sim-workflows.php]
"(1) The weather is predicted for a particular geological area. Hence, the workflow is fed with a model of the geophysical environment of ground, air and water for a requested area.
(2) Over a specified period of time (e.g. 6 hours) several different variables are measured and observed. Ground stations, ships, airplanes, weather balloons, satellites and buoys measure the air pressure, air/ water temperature, wind velocity, air humidity, vertical temperature profiles, cloud velocity, rain fall, and more.
(3) This data needs to be collected from the different sources and stored for later access.
(4) The collected data is analyzed and transformed into a common format (e.g. Fahrenheit to Celsius scale). The normalized values are used to create the current state of the atmosphere.
(5) Then, a numerical weather forecast is made based on mathematical-physical models (e.g. GFS - Global Forecast System, UKMO - United Kingdom MOdel, GME - global model of Deutscher Wetterdienst). The environmental area needs to be discretized beforehand using grid cells. The physical parameters measured in Step 2 are exposed in 3D space as timely function. This leads to a system of partial differential equations reflecting the physical relations that is solved numerically.
(6) The results of the numerical models are complemented with a statistical interpretation (e.g. with MOS - Model-Output-Statistics). That means the forecast result of the numerical models is compared to statistical weather data. Known forecast failures are corrected.
(7) The numerical post-processing is done with DMO (Direct Model Output): the numerical results are interpolated for specific geological locations.
(8) Additionally, a statistical post-processing step removes failures of measuring devices (e.g. using KALMAN filters).
(9) The statistical interpretation and the numerical results are then observed and interpreted by meteorologists based on their subjective experiences.
(10) Finally, the weather forecast is visualized and presented to interested people." [iaas.uni-stuttgart.de/ forschung/ projects/ simtech/ sim-workflows.php]
The example "Workflow diagram - Weather forecast" was drawn using the ConceptDraw PRO diagramming and vector drawing software extended with the Workflow Diagrams solution from the Business Processes area of ConceptDraw Solution Park.
Work flow chart

"Telecommunication is communication at a distance by technological means, particularly through electrical signals or electromagnetic waves. ...
Electrical and electromagnetic telecommunication technologies include telegraph, telephone, and teleprinter, networks, radio, microwave transmission, fiber optics, communications satellites and the Internet." [Telecommunication. Wikipedia]
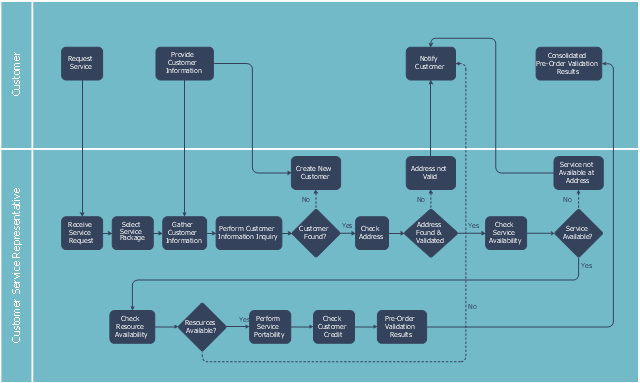
"A telecommunications service provider or TSP is a type of communications service provider that has traditionally provided telephone and similar services. This category includes incumbent local exchange carriers, competitive local exchange carriers, and mobile wireless communication companies. ...
While some people use the terms "telecom service provider" and "communications service provider" interchangeably, the term TSP generally excludes Internet service providers (ISPs), cable companies, satellite TV, and managed service providers. ...
TSPs provide access to telephone and related communications services." [Telecommunications service provider. Wikipedia]
The cross-functional flowchart example "Providing telecom services" was created using the ConceptDraw PRO diagramming and vector drawing software extended with the Cross-Functional Flowcharts solution from the Business Processes area of ConceptDraw Solution Park.
Electrical and electromagnetic telecommunication technologies include telegraph, telephone, and teleprinter, networks, radio, microwave transmission, fiber optics, communications satellites and the Internet." [Telecommunication. Wikipedia]
"A telecommunications service provider or TSP is a type of communications service provider that has traditionally provided telephone and similar services. This category includes incumbent local exchange carriers, competitive local exchange carriers, and mobile wireless communication companies. ...
While some people use the terms "telecom service provider" and "communications service provider" interchangeably, the term TSP generally excludes Internet service providers (ISPs), cable companies, satellite TV, and managed service providers. ...
TSPs provide access to telephone and related communications services." [Telecommunications service provider. Wikipedia]
The cross-functional flowchart example "Providing telecom services" was created using the ConceptDraw PRO diagramming and vector drawing software extended with the Cross-Functional Flowcharts solution from the Business Processes area of ConceptDraw Solution Park.
Cross-functional flow chart
Telecommunications Networks

Types of Flowchart - Overview


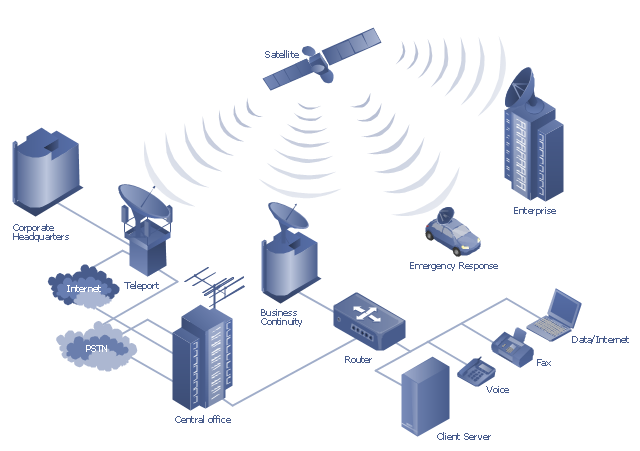
"A communications satellite or comsat is an artificial satellite sent to space for the purpose of telecommunications. Modern communications satellites use a variety of orbits including geostationary orbits, Molniya orbits, elliptical orbits and low (polar and non-polar) Earth orbits.
For fixed (point-to-point) services, communications satellites provide a microwave radio relay technology complementary to that of communication cables. They are also used for mobile applications such as communications to ships, vehicles, planes and hand-held terminals, and for TV and radio broadcasting." [Communications satellite. Wikipedia]
"Satellite telecommunication services:
Satellite crop monitoring,
Satellite Internet access,
Satellite navigation,
Satellite phone,
Satellite radio,
Satellite television." [Satellite. Wikipedia]
This hybrid satellite and common carrier network diagram example was created using the ConceptDraw PRO diagramming and vector drawing software extended with the Telecommunication Network Diagrams solution from the Computer and Networks area of ConceptDraw Solution Park.
Satellite network diagram
IDEF0 Flowchart Symbols

 Telecommunication Network Diagrams
Telecommunication Network Diagrams solution extends ConceptDraw PRO software with samples, templates, and great collection of vector stencils to help the specialists in a field of networks and telecommunications, as well as other users to create Computer systems networking and Telecommunication network diagrams for various fields, to organize the work of call centers, to design the GPRS networks and GPS navigational systems, mobile, satellite and hybrid communication networks, to construct the mobile TV networks and wireless broadband networks.
Organizational Charts with ConceptDraw PRO

Total Quality Management Definition

Data Flow Diagram (DFD)
")
Network Diagram Software


3D Network Diagram Software

ConceptDraw PRO

- Satellite Launching For Flow Chart
- Function Of Satellite In Flowchart
- Hybrid satellite and common carrier network diagram | Flowchart ...
- Cross-Functional Flowchart | Mobile satellite TV network diagram ...
- Mobile Satellite Flowchart
- Sign Making Software | Types of Flowchart - Overview | All Ooad ...
- Mobile satellite TV network diagram | Basic Flowchart Symbols and ...
- Hybrid satellite and common carrier network diagram | Providing ...
- Flowchart Of Man Made Satellite
- Weather forecast | Satellite Weather Data Flowchart Gfs Model
- Telecommunication Network Diagrams | Mobile satellite TV network ...
- Building Networks | Mobile satellite TV network diagram | Bank ...
- Mobile satellite TV network diagram | Television networks. Computer ...
- Computer and Network Examples | Satellites | Types of Flowchart
- Flowchart Of The Operation Of A Satellite
- Diagram Of A Broadcast Station Flowchart
- Satellite Broadcasting Flowchart Diagram
- Providing telecom services - Cross-functional flowchart | Process ...
- IDEF0 Flowchart Symbols | System Integrators For Broadcast ...