Flowchart Design Flowchart Symbols, Shapes, Stencils and Icons


How to Build a Flowchart

Technical Flow Chart Example

The vector stencils library "Flowchart" contains 26 symbols for drawing the flow charts using the ConceptDraw PRO diagramming and vector drawing software.
"Flowcharts are used in designing and documenting complex processes or programs. Like other types of diagrams, they help visualize what is going on and thereby help the viewer to understand a process, and perhaps also find flaws, bottlenecks, and other less-obvious features within it. There are many different types of flowcharts, and each type has its own repertoire of boxes and notational conventions. The two most common types of boxes in a flowchart are:
(1) a processing step, usually called activity, and denoted as a rectangular box;
(2) a decision, usually denoted as a diamond.
A flowchart is described as "cross-functional" when the page is divided into different swimlanes describing the control of different organizational units. A symbol appearing in a particular "lane" is within the control of that organizational unit. This technique allows the author to locate the responsibility for performing an action or making a decision correctly, showing the responsibility of each organizational unit for different parts of a single process. ...
Common alternate names include: flowchart, process flowchart, functional flowchart, process map, process chart, functional process chart, business process model, process model, process flow diagram, work flow diagram, business flow diagram. The terms "flowchart" and "flow chart" are used interchangeably." [Flowchart. Wikipedia]
The example "Design elements - Flowchart" is included in the Flowcharts solution from the area "What is a Diagram" of ConceptDraw Solution Park.
Flowchart notation

Flow Chart Design — How to Design a Good Flowchart

Technical Flow Chart

Create Flowchart - Making a Flowchart

Cross Functional Flowchart

HelpDesk
How To Create MS Visio Cross-Functional Flowchart

Flowchart Examples

The vector stencils library "Audit flowcharts" contains 31 symbols of audit flow chart diagrams for accounting, financial management, fiscal information tracking, money management, decision flowcharts, and financial inventories.
"A financial audit, or more accurately, an audit of financial statements, is the verification of the financial statements of a legal entity, with a view to express an audit opinion. The audit opinion is intended to provide reasonable assurance, but not absolute assurance, that the financial statements are presented fairly, in all material respects, and/ or give a true and fair view in accordance with the financial reporting framework. The purpose of an audit is to provide an objective independent examination of the financial statements, which increases the value and credibility of the financial statements produced by management, thus increase user confidence in the financial statement, reduce investor risk and consequently reduce the cost of capital of the preparer of the financial statements. ...
Financial audits are typically performed by firms of practicing accountants who are experts in financial reporting. The financial audit is one of many assurance functions provided by accounting firms. Many organizations separately employ or hire internal auditors, who do not attest to financial reports but focus mainly on the internal controls of the organization. External auditors may choose to place limited reliance on the work of internal auditors. Auditing promotes transparency and accuracy in the financial disclosures made by an organization, therefore would likely to reduce of such corporations to conceal unscrupulous dealings.
Internationally, the International Standards on Auditing (ISA) issued by the International Auditing and Assurance Standards Board (IAASB) is considered as the benchmark for audit process. Almost all jurisdictions require auditors to follow the ISA or a local variation of the ISA." [Financial audit. Wikipedia]
The example "Design elements - Audit flowchart" was created using the ConceptDraw PRO diagramming and vector drawing software extended with the Audit Flowcharts solution from the Finance and Accounting area of ConceptDraw Solution Park.
Audit flowchart symbols

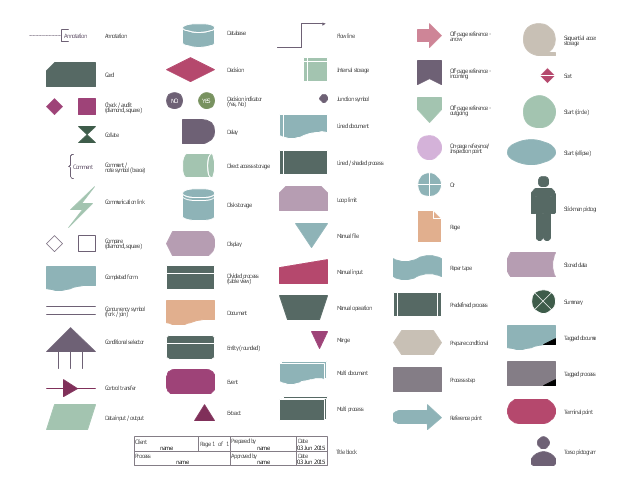
SDL Flowchart Symbols

HelpDesk
How To Create MS Visio Flowchart

Flow Chart Symbols

What process should be essentially adopted. Accounting Flowchart Example

HR Flowchart Symbols

The vector stencils library "HR flowchart" contains 62 flow chart symbols.
Use it to design your HR flowcharts, workflow diagrams and process charts by the ConceptDraw PRO diagramming and vector drawing software.
"Flowcharts are used in designing and documenting simple processes or programs. Like other types of diagrams, they help visualize what is going on and thereby help understand a process, and perhaps also find flaws, bottlenecks, and other less-obvious features within it. There are many different types of flowcharts, and each type has its own repertoire of boxes and notational conventions. The two most common types of boxes in a flowchart are:
(1) a processing step, usually called activity, and denoted as a rectangular box,
(2) a decision, usually denoted as a diamond." [Flowchart. Wikipedia]
The shapes example "Design elements - HR flowchart" is included in the HR Flowcharts solution from the Management area of ConceptDraw Solution Park.
Flowchart symbols
How To Create a Flow Chart in ConceptDraw

Contoh Flowchart

- Basic Flowchart Symbols and Meaning | Control System Design ...
- Basic of Flowchart : Meaning and Symbols | Audit Flowchart Symbols ...
- Cross Functional Flowchart Symbols
- Sales Process Flowchart Symbols | Concept Map Maker | Flowcharts ...
- UML Flowchart Symbols | Process Flowchart Symbols | HR ...
- Flowchart design . Flowchart symbols, shapes, stencils and icons ...
- Approval Process and Segregation of Responsibilities Accounting ...
- Basic Flowchart Symbols and Meaning | Flowchart design ...
- Object-Oriented Design | Types of Flowcharts | UML Flowchart ...
- Database Flowchart Symbols | Symbols In Database Design