 Fishbone Diagrams
The Fishbone Diagrams solution extends ConceptDraw DIAGRAM software with the ability to easily draw the Fishbone Diagrams (Ishikawa Diagrams) to clearly see the cause and effect analysis and also problem solving. The vector graphic diagrams produced using this solution can be used in whitepapers, presentations, datasheets, posters, and published technical material.
 Fishbone Diagram
Fishbone Diagrams solution extends ConceptDraw DIAGRAM software with templates, samples and library of vector stencils for drawing the Ishikawa diagrams for cause and effect analysis.
Venn Diagram Examples for Problem Solving. Environmental Social Science. Human Sustainability Confluence
The Venn diagram example below shows sustainable development at the confluence of three constituent parts. Create your Venn diagrams for problem solving in environmental social science using the ConceptDraw DIAGRAM diagramming and vector drawing software extended with the Venn Diagrams solution from the area "Diagrams" of ConceptDraw Solution Park.Competitor Analysis
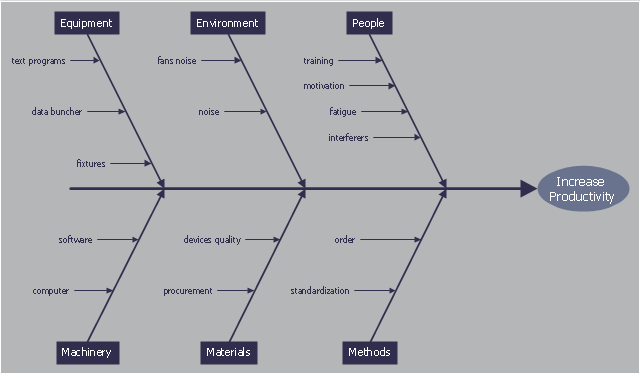
Competitor analysis is a first and obligatory step in elaboration the proper corporate marketing strategy and creating sustainable competitive advantage. Use powerful opportunities of numerous solutions from ConceptDraw Solution Park for designing illustrative diagrams, charts, matrices which are necessary for effective competitor analysis.This cause and effect diagram sample was redesigned from the Wikimedia Commons file: Ursache Wirkung Diagramm Beispiel.png. [commons.wikimedia.org/ wiki/ File:Ursache_ Wirkung_ Diagramm_ Beispiel.png]
This file is licensed under the Creative Commons Attribution-Share Alike 3.0 Unported license. [creativecommons.org/ licenses/ by-sa/ 3.0/ deed.en]
"Productivity is the ratio of output to inputs in production; it is an average measure of the efficiency of production. Efficiency of production means production’s capability to create incomes which is measured by the formula real output value minus real input value.
Productivity is a crucial factor in production performance of firms and nations. Increasing national productivity can raise living standards because more real income improves people's ability to purchase goods and services, enjoy leisure, improve housing and education and contribute to social and environmental programs. Productivity growth also helps businesses to be more profitable." [Productivity. Wikipedia]
The fishbone diagram example "Increase in productivity" was created using the ConceptDraw PRO diagramming and vector drawing software extended with the Fishbone Diagrams solution from the Management area of ConceptDraw Solution Park.
Seven Basic Tools of Quality — Quality Control
ConceptDraw DIAGRAM diagramming and vector drawing software extended with Seven Basic Tools of Quality solution from the Quality area of ConceptDraw Solution Park provides effective tools for quality control and helps design any types of quality-related diagrams.ConceptDraw Arrows10 Technology
How should diagramming software work? The answer is - Fast and easy. "Tree"- mode drawing works like that. Just select objects in your drawing and press Tree or Chain button to connect all of them just in one click. Your diagram looks professional and it took only a moment to draw.8 Step Problem Solving
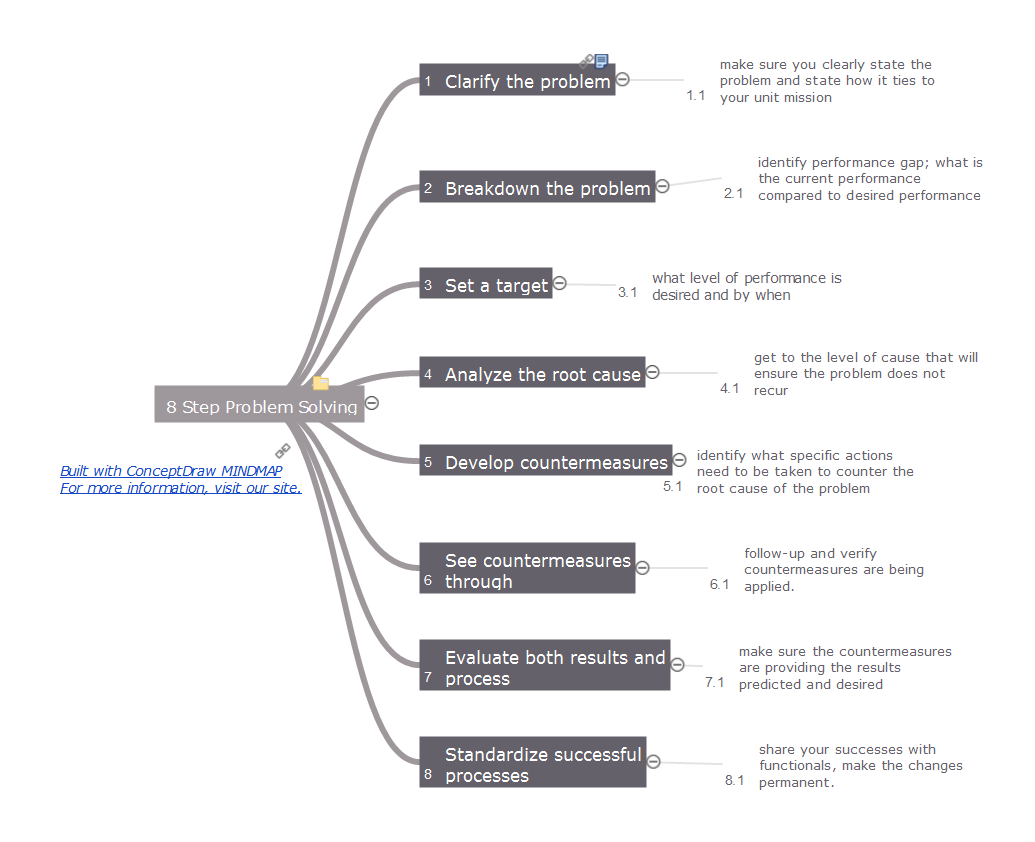
Time by time the problems appear in any field of our life and activities, and we can't to escape this. Any problem always has a certain content, the reasons and the circle of involved people. But the main task of any human, any organization, any company that was faced with a problem, is not to get lost and vice versa confidently look for the ways of solving this problem. The first you need to clarify the problem's essence, then to breakdown your problem and set a target. The most responsible step is to identify the cause-effect relationship, because each problem has its own root causes, and their detection will allow qualitatively solve this problem and avoid the similar problems in a future. Then you need to develop the countermeasures to counter the root cause of the problem and to make sure in their effectiveness, that they lead to the desired results. And finally standardize successful processes. This Mind Map designed with help of ConceptDraw MINDMAP software represents step-by-step the 8 steps approach of solving any kind of product or service problems.Relations Diagram
The Relations Diagram is used to identify how the factors influence each other, to determine what factors are causes and what are effects. The factors mostly influencing are called “drivers”, the primarily affected factors are “indicators”. The problem solving is focused on the change of "drivers" factors by applying the corrective actions. The "indicators" factors help establish the Key Performance Indicators (KPIs) to monitor the changes and also define the effectiveness of the corrective actions in resolving a problem. ConceptDraw MINDMAP software ideally suits for designing Relations Diagrams. The easiest way to create the MINDMAP Relations Diagram, is to use the included Relations Diagram input template. Open it in ConceptDraw MINDMAP application from the Input tab and hold a new brainstorming session, identify the central issue and the contributing factors to this issue. Click the Finish Brainstorm button to generate a Mind Map and begin the further work with it, or select Relations Diagram item from the Output tab to automatically draw it in ConceptDraw DIAGRAM application.ConceptDraw DIAGRAM Compatibility with MS Visio
The powerful diagramming and business graphics tools are now not exception, but the norm for today’s business, which develop in incredibly quick temp. But with the abundance of powerful business diagramming applications it is important to provide their compatibility for effective exchange the information between the colleagues and other people who maybe use different software in their work. During many years Microsoft Visio™ was standard file format for the business and now many people need the visual communication software tools that can read the Visio format files and also export to Visio format. The powerful diagramming and vector drawing software ConceptDraw DIAGRAM is ideal from the point of view of compatibility with MS Visio. Any ConceptDraw DIAGRAM user who have the colleagues that use MS Visio or any who migrates from Visio to ConceptDraw DIAGRAM , will not have any problems. The VSDX (Visio′s open XML file format) and VDX formatted files can be easily imported and exported by ConceptDraw DIAGRAM , you can see video about this possibility.Business Diagram Software
When managing the projects, people, or networks, there are daily designed and used different types of Business diagrams, so the powerful drawing software will be very useful for this. ConceptDraw DIAGRAM with large quantity of business solutions will meet your needs and will help you convey your ideas successful and rapidly, no matter are you professional or beginner. It is the best choice for business specialists and technical professionals who need quickly and easily explore, visualize, and communicate information. ConceptDraw DIAGRAM business diagram software is the most powerful business software and relational charting software. Create advanced, completely customizable Business Process Diagrams, Business Flow Charts, Work Flow Diagrams, Organizational Charts, Audit diagrams, Marketing diagrams, Value Stream Maps, TQM diagrams, ERD diagrams, EPC diagrams, Cause and Effect diagrams, Infographics, Dashboards, and other Relational business diagrams from your data using the powerful drawing tools of ConceptDraw Solution Park.
 Social Media Response
This solution extends ConceptDraw DIAGRAM and ConceptDraw MINDMAP with the ability to draw interactive flow charts with action mind map templates, to help create an effective response to applicable social media mentions.
Flowchart Software
Flowchart is a simple diagram, map or graphical schematic representation the sequence of actions within a process. It is ideal for displaying how a process currently flows or can function ideally. The Flowcharts let define the steps and boundaries of a process, uncover problems or miscommunications. The Flowcharts are widely used in education, software development, business, economics, thanks to their visuality they are ideal for presentations, reports, for using on conferences to help the audience comprehend the content better, or easy find flaws in a process flow diagrams. ConceptDraw DIAGRAM is professional flowcharts software and feature-rich flowchart maker, which supports Mac OS X and Windows. It contains at ConceptDraw Solution Park a rich set of stencils and professional flowchart symbols for design. It lets create simply professional-looking Flowcharts based on thousand free flowchart templates, colored symbols and examples. ConceptDraw DIAGRAM is a 3 times cheaper alternative to MS Visio available for both Mac and PC. It’s is another full featured business and technical diagramming application that can easily take care of Visio files within OS X. Another bonus with ConceptDraw DIAGRAM – it's cross-platform. You can work on a document in both OS X and Windows, skipping Visio entirely.
Simple Drawing Applications for Mac
ConceptDraw gives the ability to draw simple diagrams like flowcharts, block diagrams, bar charts, histograms, pie charts, divided bar diagrams, line graphs, area charts, scatter plots, circular arrows diagrams, Venn diagrams, bubble diagrams, concept maps, and others.
 Fault Tree Analysis Diagrams
This solution extends ConceptDraw DIAGRAM.5 or later with templates, fault tree analysis example, samples and a library of vector design elements for drawing FTA diagrams (or negative analytical trees), cause and effect diagrams and fault tree diagrams.
- Fishbone Diagram Problem Solving | Using Fishbone Diagrams for ...
- How Do Fishbone Diagrams Solve Manufacturing Problems | Cause ...
- Wiki Fishbone Diagram
- Fishbone Diagram | Using Fishbone Diagrams for Problem Solving ...
- Business Productivity - Management | Social Media Response | Fish ...
- Venn Diagram Examples for Problem Solving. Environmental Social ...
- Using Fishbone Diagrams for Problem Solving | Fishbone Diagram ...
- Cause and Effect Analysis - Fishbone Diagrams for Problem Solving ...
- Using Fishbone Diagrams for Problem Solving | SWOT Analysis ...
- Ishikawa Diagram Process
- Using Fishbone Diagrams for Problem Solving | PROBLEM ...
- Cause and Effect Analysis - Fishbone Diagrams for Problem Solving ...
- How to Add a Fishbone Diagram to a PowerPoint Presentation ...
- Fishbone Diagrams | Fishbone Diagram | Entity Relationship ...
- Fishbone Diagram Problem Solving | Venn Diagram Examples for ...
- Ishikawa Diagram | Fishbone Diagram Example | Ishikawa fishbone ...
- Ishikawa Diagram For System Development
- Manufacturing 8 Ms fishbone diagram - Template | How Do ...
- Fishbone diagram - HAN project | Relationships Analysis | Relations ...


