Accounting Flowchart Symbols

Basic Flowchart Symbols and Meaning


Process Flow Chart Symbol

Entity Relationship Diagram Symbols

Electrical Symbols, Electrical Diagram Symbols

HR Flowchart Symbols

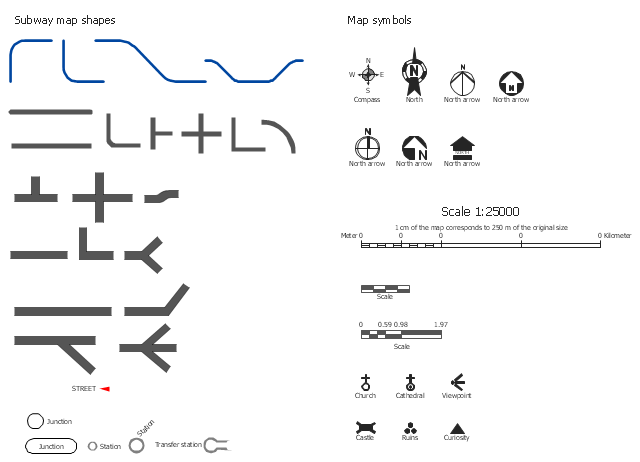
The vector stencils library Map symbols contains 19 icons for labeling the maps using the ConceptDraw PRO diagramming and vector drawing software.
The vector stencils library Subway map contains 41 shapes for creating the subway (tube, metro) maps using the ConceptDraw PRO.
"The various features shown on a map are represented by conventional signs or symbols. For example, colors can be used to indicate a classification of roads. Those signs are usually explained in the margin of the map, or on a separately published characteristic sheet.
Some cartographers prefer to make the map cover practically the entire screen or sheet of paper, leaving no room "outside" the map for information about the map as a whole. These cartographers typically place such information in an otherwise "blank" region "inside" the map -- cartouche, map legend, title, compass rose, bar scale, etc. In particular, some maps contain smaller "sub-maps" in otherwise blank regions—often one at a much smaller scale showing the whole globe and where the whole map fits on that globe, and a few showing "regions of interest" at a larger scale in order to show details that wouldn't otherwise fit." [Map. Wikipedia]
The example "Design elements - Subway map, Map symbols" is included in the Directional Maps solution from the Maps area of ConceptDraw Solution Park.
Map symbols
ERD Symbols and Meanings


Business Process Flowchart Symbols

Mechanical Drawing Symbols

Process Flow Diagram Symbols

Social Media Flowchart Symbols

Audit Flowchart Symbols

SDL Flowchart Symbols

Gane Sarson Diagram

How To use House Electrical Plan Software


Swim Lane Flowchart Symbols

Flow Chart Symbols

Value Stream Mapping Symbols

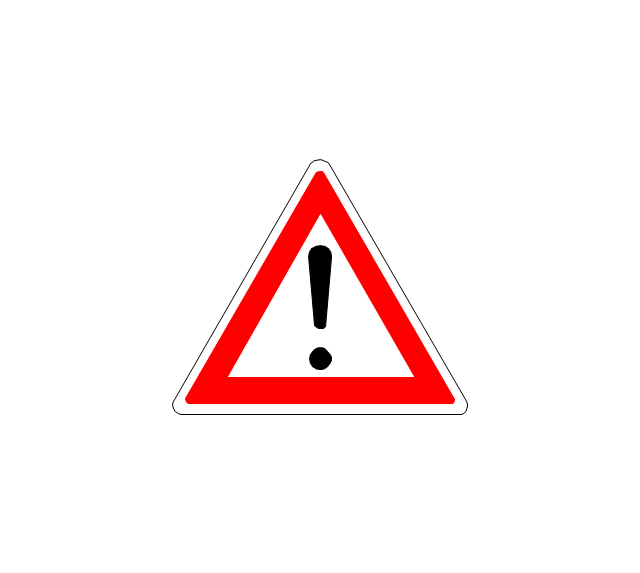
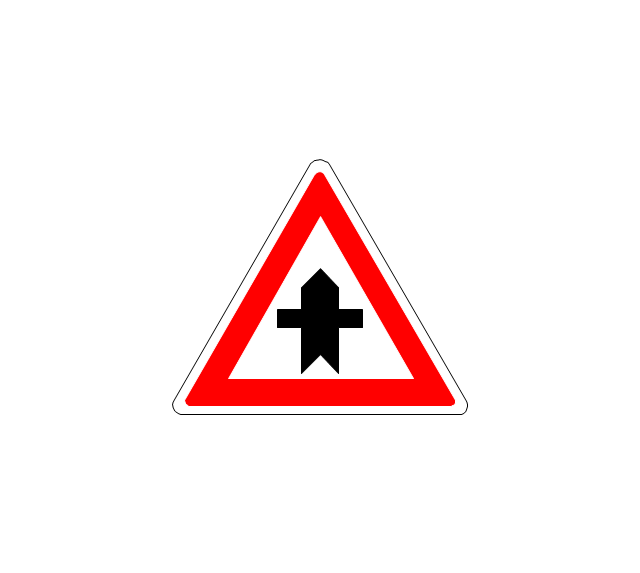
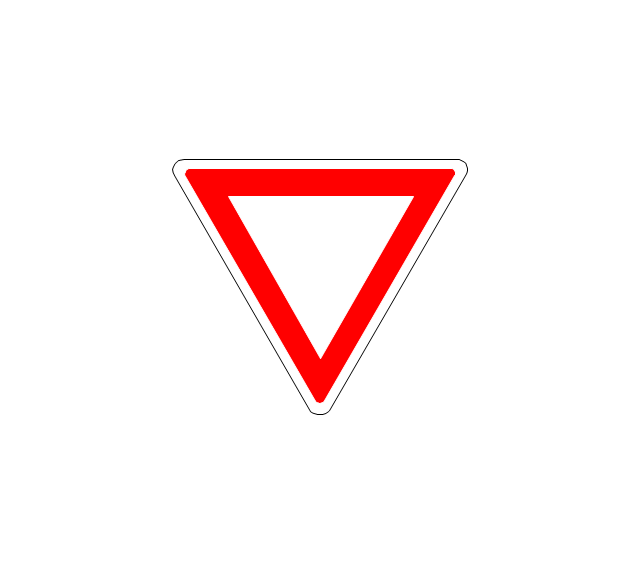
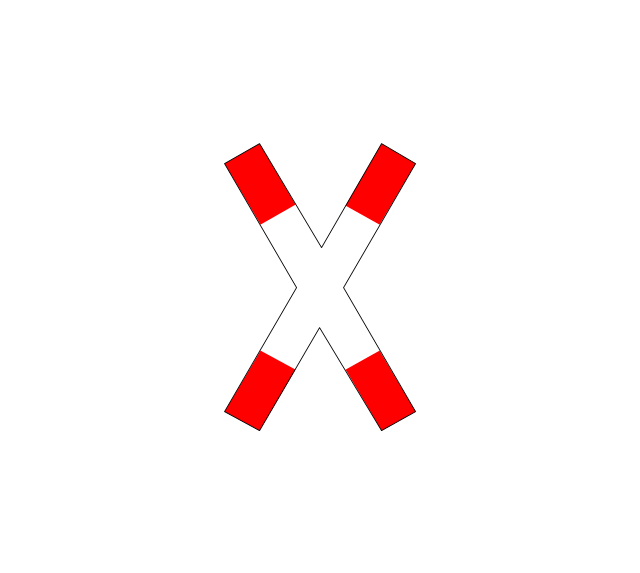
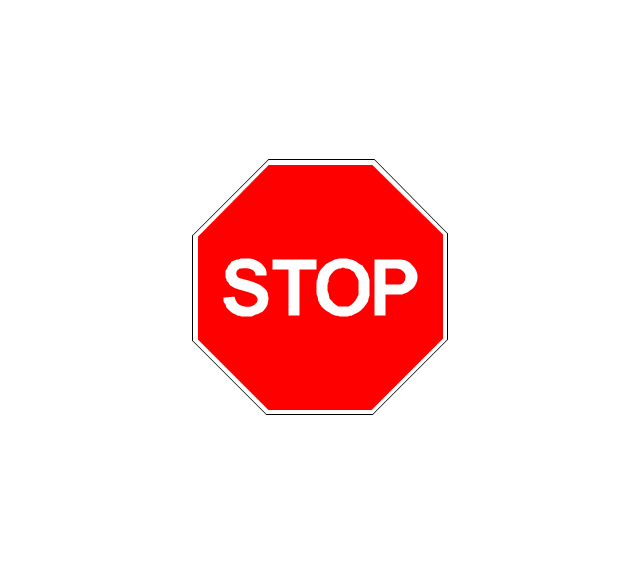
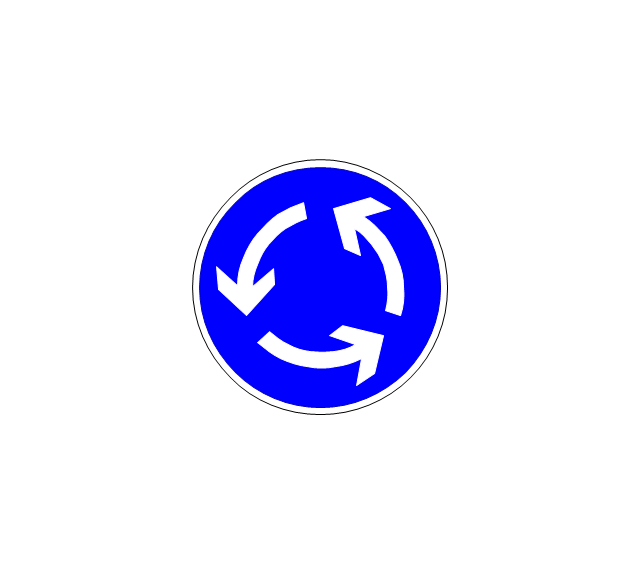
The vector stencils library "Road signs" contains 58 symbols of road signs for labeling the road and route maps, directional and transit maps, street and locator maps.
"Traffic signs or road signs are signs erected at the side of or above roads to give instructions or provide information to road users.
... many countries have adopted pictorial signs or otherwise simplified and standardized their signs to overcome language barriers, and enhance traffic safety. Such pictorial signs use symbols (often silhouettes) in place of words and are usually based on international protocols. Such signs were first developed in Europe, and have been adopted by most countries to varying degrees." [Traffic sign. Wikipedia]
The pictograms example "Road signs - Vector stencils library" was created using the ConceptDraw PRO diagramming and vector drawing software extended with the Directional Maps solution from the Maps area of ConceptDraw Solution Park.
www.conceptdraw.com/ solution-park/ maps-directional
Danger place
Intersection
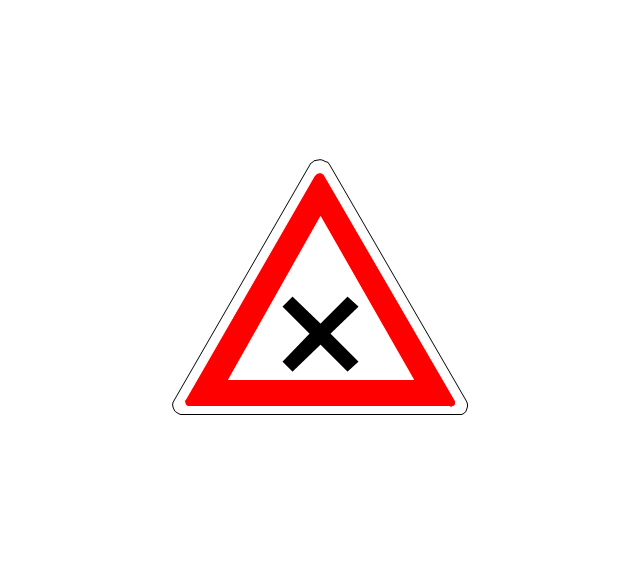
Intersection 2
Bend
Double bend
Two-way traffic
Mobile bridge
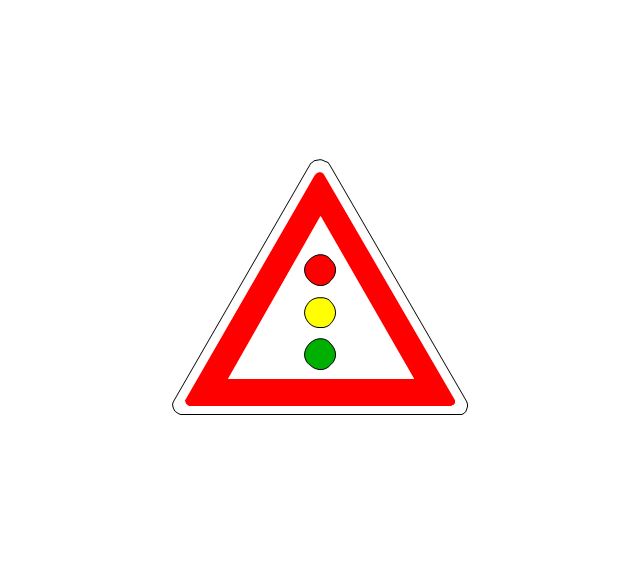
Light signal
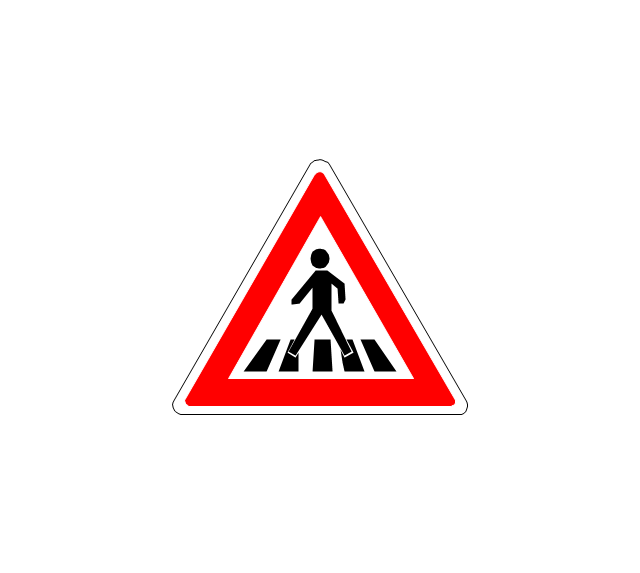
Pedestrian crossing
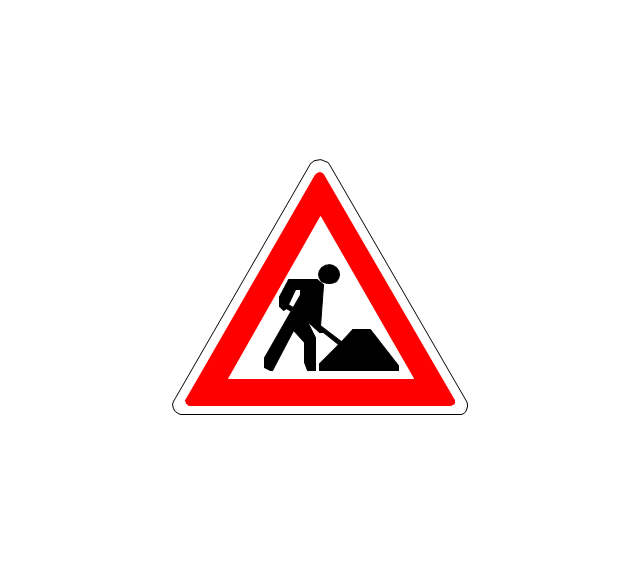
Road work
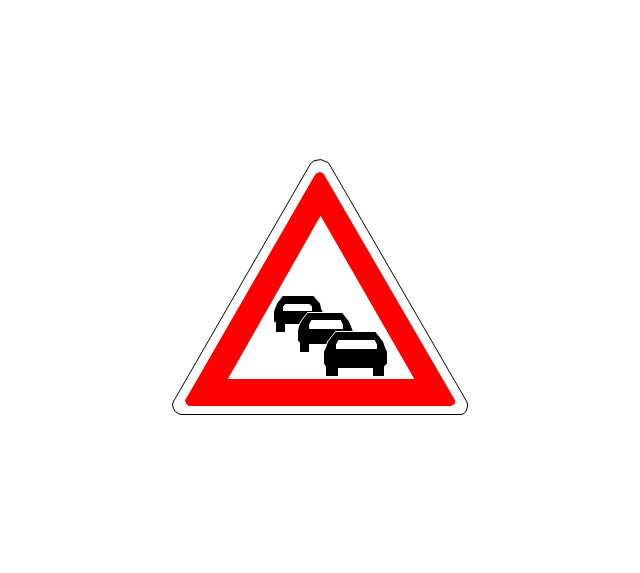
Back-up
Give way
Crossing
Stop
Roundabout
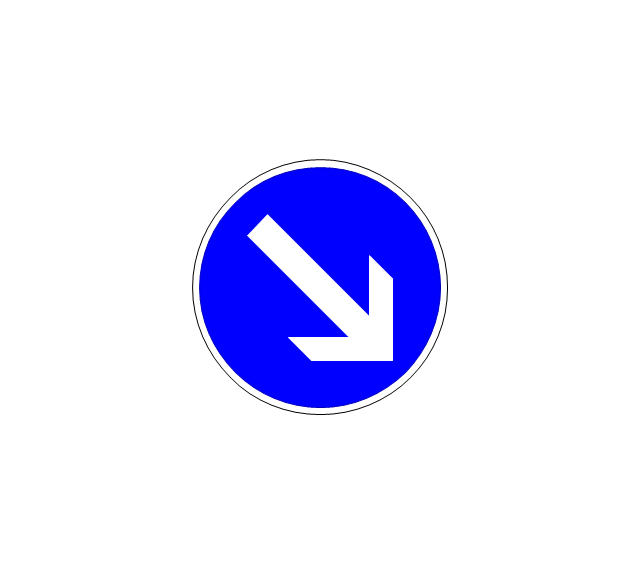
Pass this side
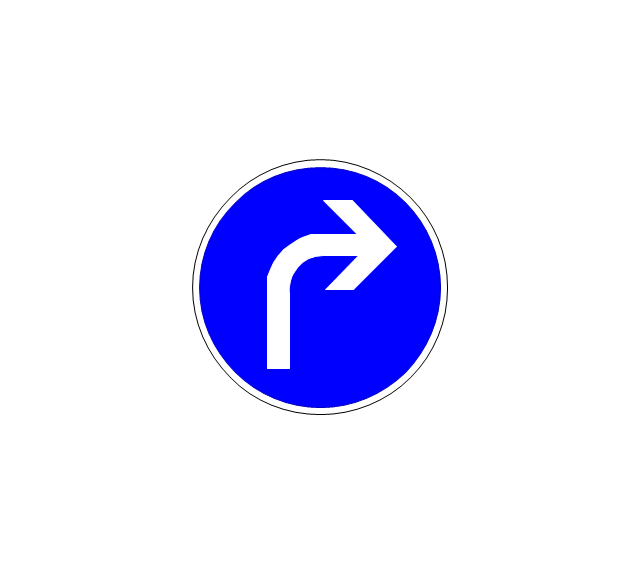
Direction to be followed
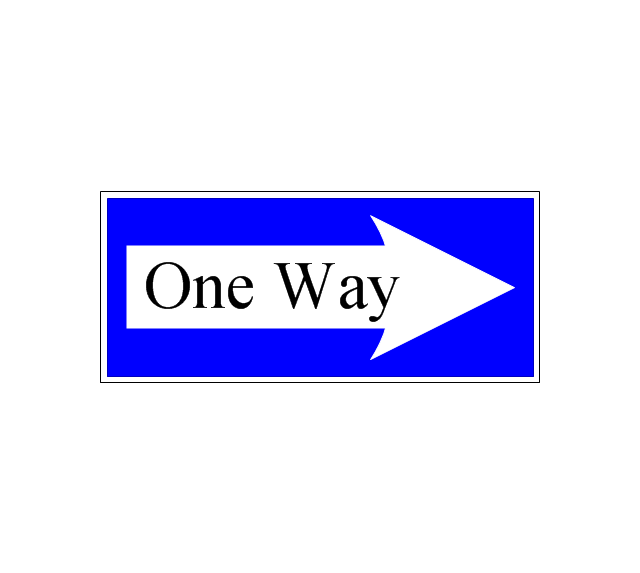
One-way street
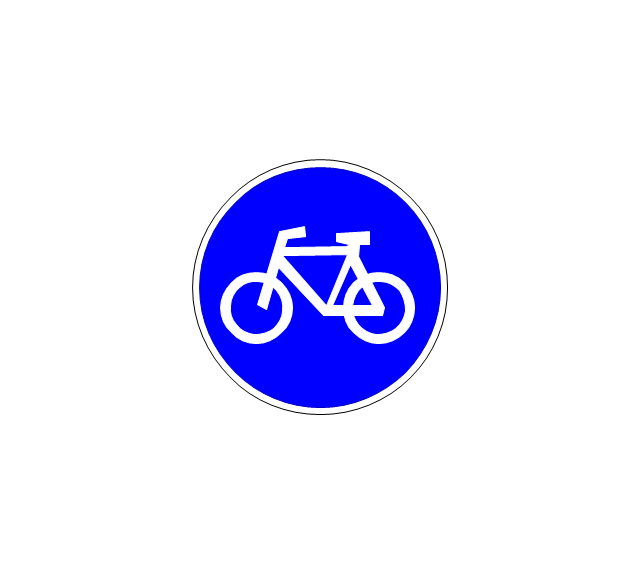
Cycle track
No entry
No entry both directions

No power vehicles
No U-turns
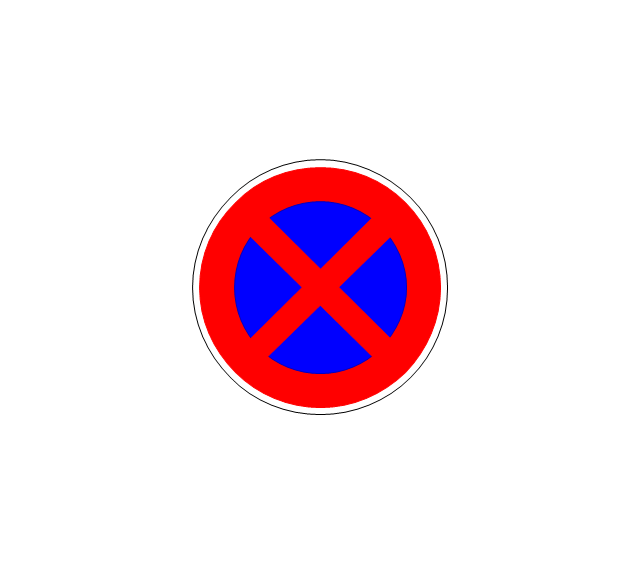
No passing without stopping
No standing and parking
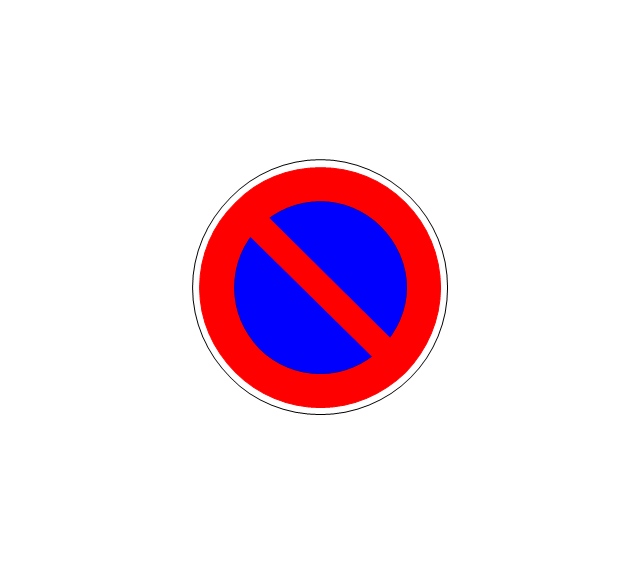
No parking
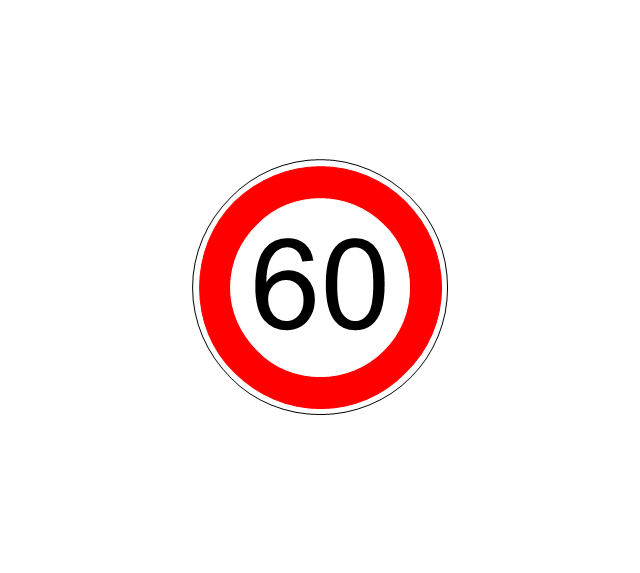
Speed limit
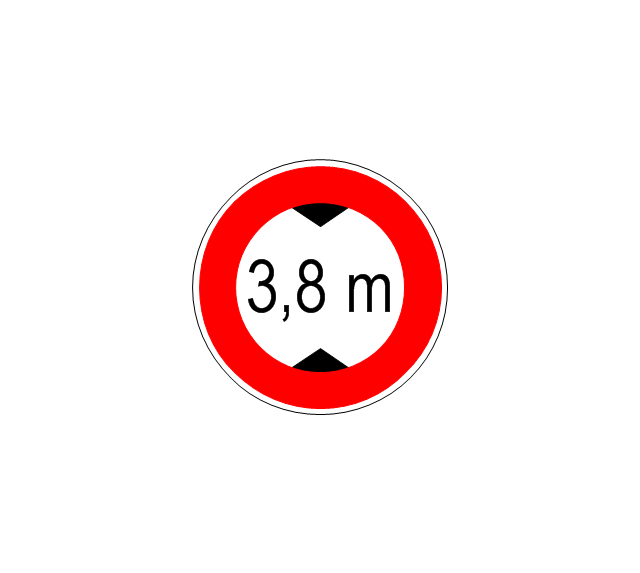
Height limit
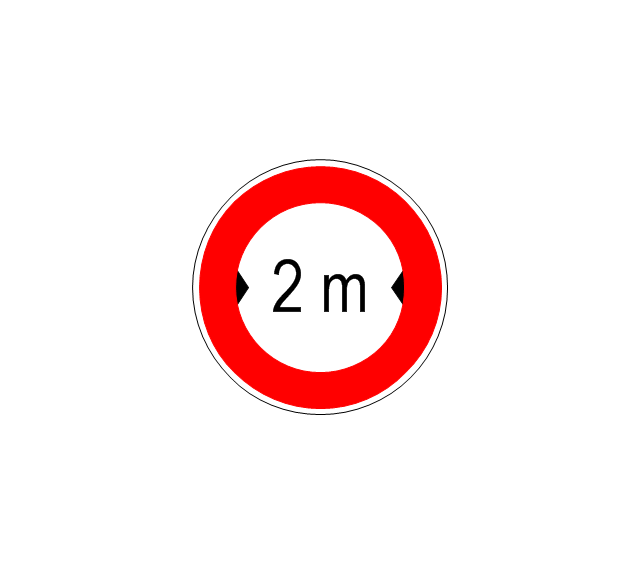
Width limit
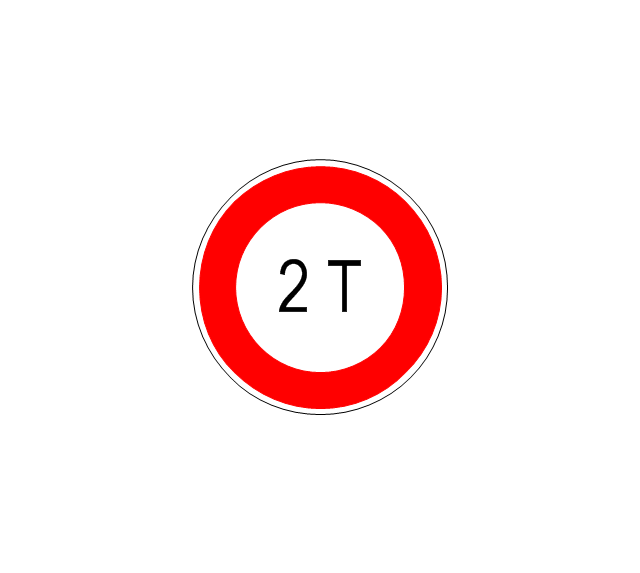
Weight limit
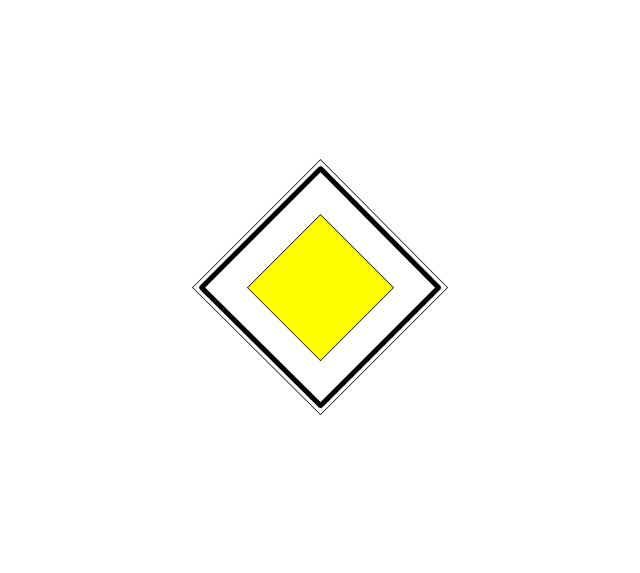
Priority over oncoming traffic
Streetcar or regular buses

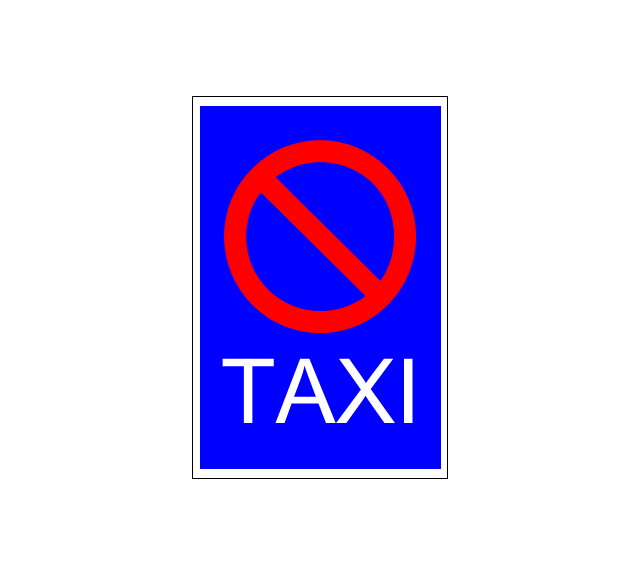
Taxi status
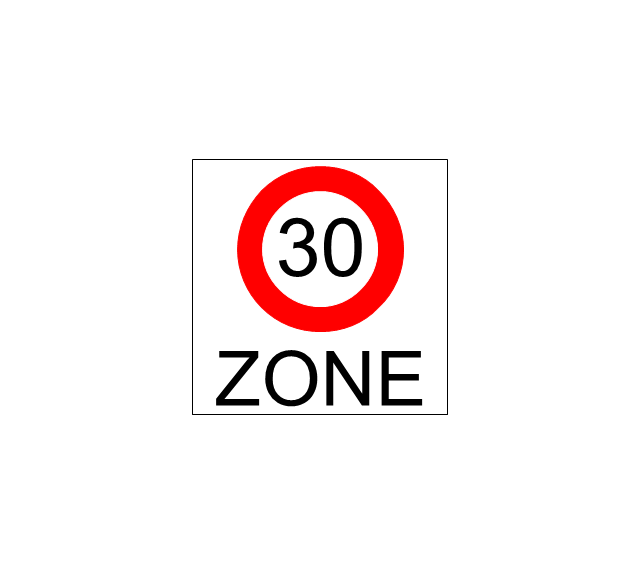
Beginning that speed 30-Zone
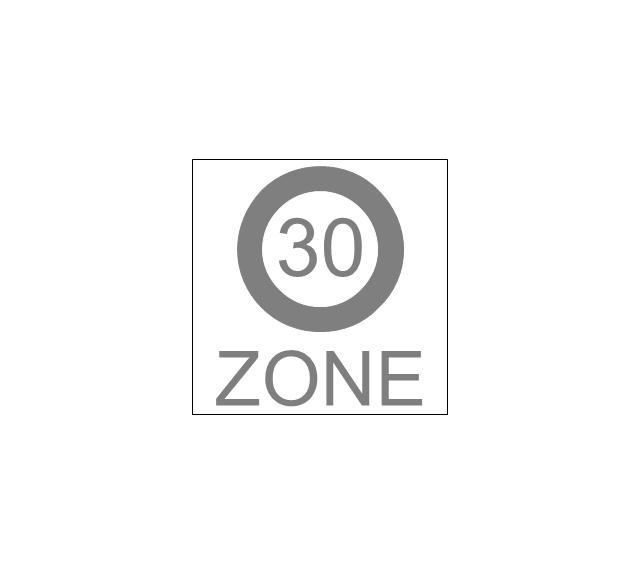
End that speed 30-Zone
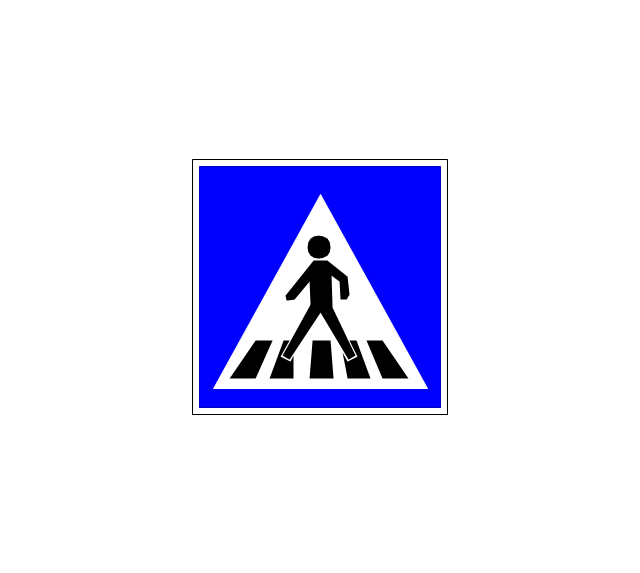
Pedestrian crossing 2
Police
Hotel
Breakdown service
Restaurant
P + R
Restroom
Fuel
Telephone

Recommended speed
Nodal point of a motorwa
Parking
Dead end
Motorway
End motorway
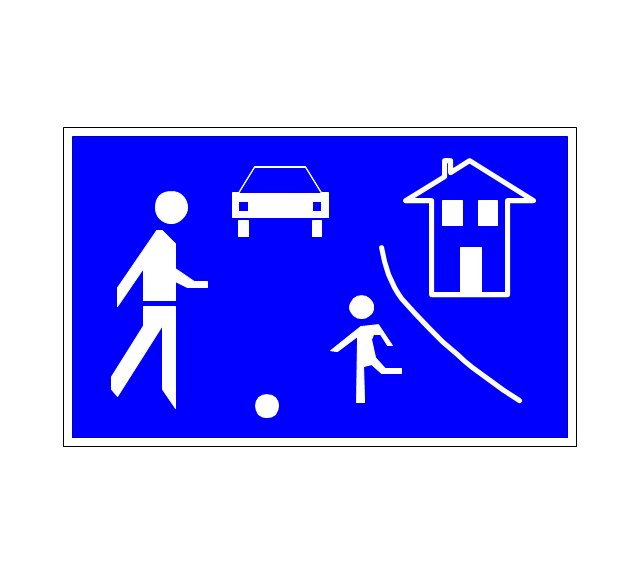
Populated zone
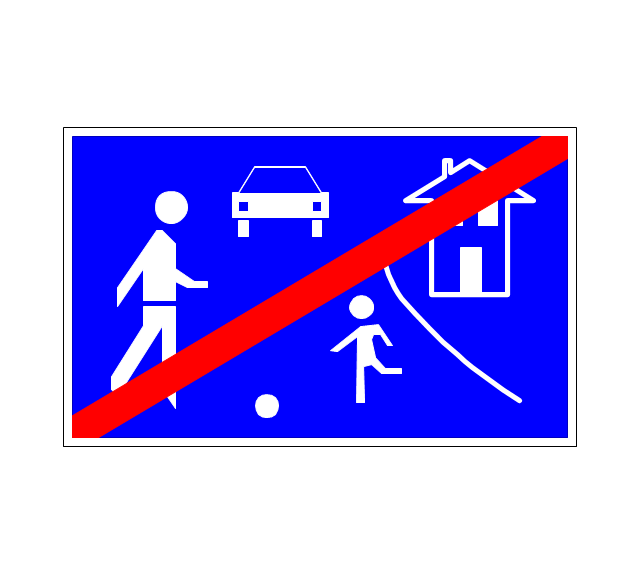
End populated zone
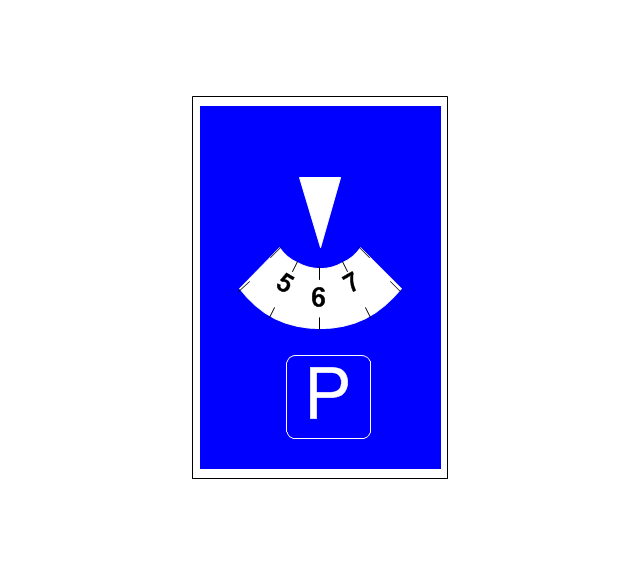
Parking with clock
Number sign (motorway)
-road-signs---vector-stencils-library.png--diagram-flowchart-example.png)
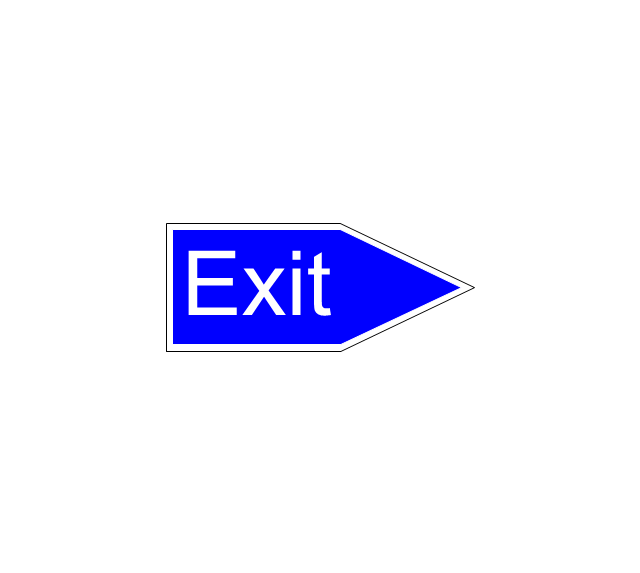
Exit
Direction to place
Board of announcement of exit
Number sign (federal highway)
-road-signs---vector-stencils-library.png--diagram-flowchart-example.png)
- Hydraulic And Pneumatic Signs And Symbols
- Conventional Signs And Symbols Wikipedia
- Sign And Symbols Of Architecture Sanitary Electrical Structural Pdf
- The Diagrams Of Conventional Signs Or Symbols
- Mechanical Drawing Sign And Symbol
- Electrical Symbols , Electrical Diagram Symbols | Home Electrical ...
- Details Of Conventional Signs And Symbols In Technical Drawing
- Draw Convectional Signs And Symbols
- Examples Of Signs And Symbols
- Road signs - Vector stencils library | Map Directions | Maps and ...
- Elements location of a welding symbol | Drawing Signs And ...
- Design elements - Subway map, Map symbols | Basic Flowchart ...
- Conventional Sign And Symbols In Building Planning
- Engineering Drawing Signs And Symbols
- Conventional Sign And Symbols In Mechanical Engineering
- Basic Flowchart Symbols and Meaning | Design elements - Subway ...
- Plumbing and Piping Plans | Plumbing Symbols And Signs
- Hydraulic And Pneumatic Conventional Signs And Symbols
- Conventional Symbol And Signs In Engineering Profession
- Conventional Signs And Symbols Diagram