Energy Pyramid Diagram

How to Create a Pyramid Diagram

Pyramid Charts

Biology Drawing

Pyramid Diagram

Diagram of a Pyramid

Pyramid Chart Examples

Pyramid Diagram

"Consumption of energy resources, (e.g. turning on a light) requires resources and has an effect on the environment. Many electric power plants burn coal, oil or natural gas in order to generate electricity for energy needs. While burning these fossil fuels produces a readily available and instantaneous supply of electricity, it also generates air pollutants including carbon dioxide (CO2), sulfur dioxide and trioxide (SOx) and nitrogen oxides (NOx). Carbon dioxide is an important greenhouse gas which is thought to be responsible for some fraction of the rapid increase in global warming seen especially in the temperature records in the 20th century, as compared with tens of thousands of years worth of temperature records which can be read from ice cores taken in Arctic regions. Burning fossil fuels for electricity generation also releases trace metals such as beryllium, cadmium, chromium, copper, manganese, mercury, nickel, and silver into the environment, which also act as pollutants.
The large-scale use of renewable energy technologies would "greatly mitigate or eliminate a wide range of environmental and human health impacts of energy use". Renewable energy technologies include biofuels, solar heating and cooling, hydroelectric power, solar power, and wind power. Energy conservation and the efficient use of energy would also help." [Energy industry. Environmental impact. Wikipedia]
The Energy resources diagram example was created in the ConceptDraw PRO diagramming and vector drawing software using the Manufacturing and Maintenance solution from the Illustration area of ConceptDraw Solution Park.
Infographics

Pyramid Diagram

How to Create a Scatter Chart

Pyramid Diagram

How to Create a Line Chart

How to Create a Pie Chart

Interior Design

 Pyramid Diagrams
Pyramid Diagrams solution extends ConceptDraw DIAGRAM software with templates, samples and library of vector stencils for drawing the marketing pyramid diagrams.
Marketing Organization Chart

Pyramid Diagram

Workflow Diagram

The vector stencils library "Computer network" contains 51 symbols of computer network devices and equipment for drawing computer network diagrams.
"Network Mapping Software.
A number of software tools exist to design computer network diagrams / or generate visual maps of networks, servers, storage, services, data centers, and other peripherals. Broadly, there are two types of software tools - those that help create diagrams manually and those that generate them using automated / semi-automated approaches.
Type of Software.
(1) Manual - allows users to design and draw logical and physical topology diagrams by manually placing icons and connections.
(2) Automated - generate topology diagrams / maps by traversing the network and automatically discovering resident devices or by importing network data." [Comparison of network diagram software. Wikipedia]
ConceptDraw PRO is the software for manual design of computer network diagrams. The solutions of the Computer and Networks area in ConceptDraw Solution Park extend ConceptDraw PRO with vector stencils libraries, templates and examples for creating the computer network diagrams.
The symbols example "Computer network - Vector stencils library" was created using the ConceptDraw PRO diagramming and vector drawing software extended with the Computer and Networks solution from the Computer and Networks area of ConceptDraw Solution Park.
www.conceptdraw.com/ solution-park/ computer-and-networks
Laptop
Desktop computer
Firewall

Bus

Ethernet
Star network

FDDI Ring

Token-ring

Comm-link

Modem
Laser printer
Inkjet printer
Image scanner
City

Ethernet hub
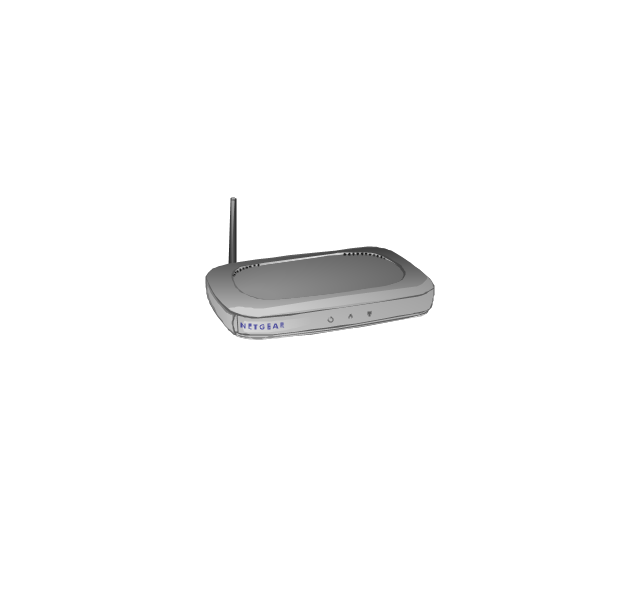
Wireless router
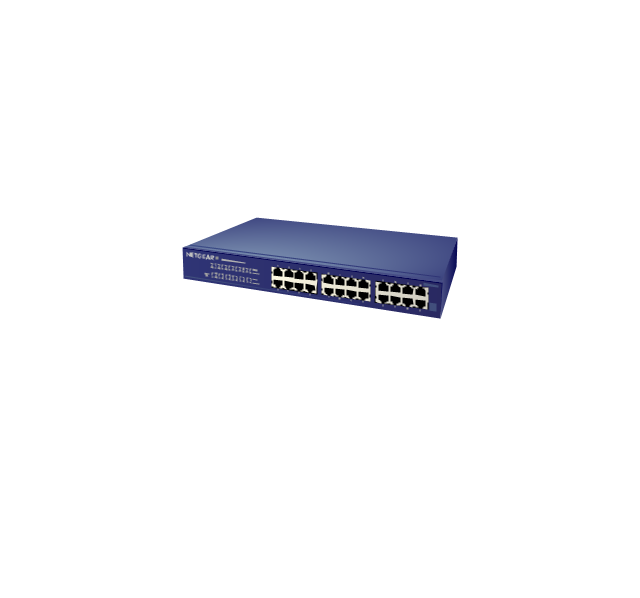
Network switch
iPod Classic

iPhone/ iPod Touch

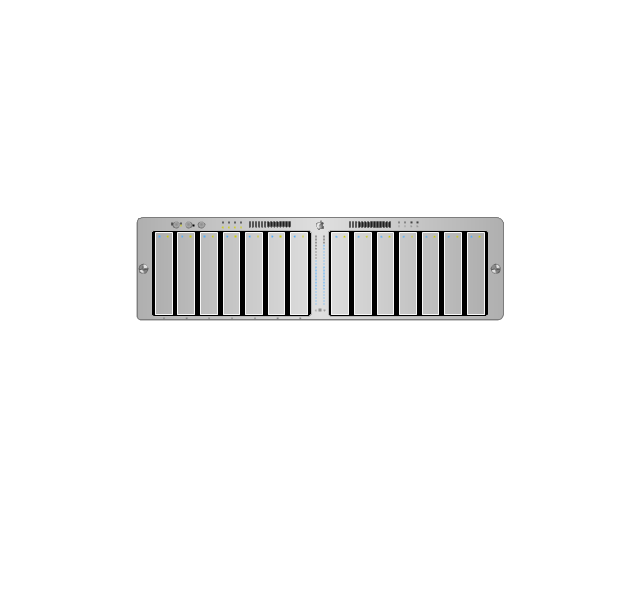
Xserve RAID
XServe

Apple Thunderbolt Display

Data store
Mac Pro
iMac
RAID
Mainframe

Rack-mountable server
Server

PDA

Cloud

Computer monitor
Workstation
Router
IP Phone
Fax
Mobile phone
Smartphone
Compact Disk

Mouse

Apple Wireless Mouse

Computer keyboard
Apple Keyboard
Radio tower

Satellite dish

Satellite
Webcam
AirPort Extreme

Airport Express
MacBook

iPhone 4

- Energy Pyramid Diagram | Pyramid Chart Maker | Diagram of a ...
- Alternate Resources Of Energy Chart To Draw
- Pyramid Chart Maker | Energy Pyramid Diagram | Pyramid Diagram ...
- Pyramid Diagram and Pyramid Chart | Energy Pyramid Diagram ...
- Energy Pyramid Diagram | Pyramid Chart Maker | Pyramid Charts ...
- Pyramid Chart Maker | Pyramid Charts | Energy Pyramid Diagram ...
- Pyramid Chart Examples | Energy Pyramid Diagram | Diagram of a ...
- How to Draw a Pyramid Diagram | Pyramid Diagram | Fundraising ...
- How to Draw a Pyramid Diagram
- Energy Pyramid Diagram | Diagram of a Pyramid | Ecosystem Map ...
- Energy Pyramid Diagram | Geo Map — United States of America ...
- How to Draw a Pyramid Diagram in ConceptDraw PRO | Pyramid ...
- Biomass Energy Drawing
- How to Draw a Pyramid Diagram in ConceptDraw PRO | 3D ...
- Energy Pyramid Diagram | Scatter Chart Examples | Chart Examples ...
- Energy Pyramid Diagram | Chart Examples | Flow chart Example ...
- Bar Chart Software | Pyramid Charts | Chart Maker for Presentations ...
- Target and Circular Diagrams | | Pie Charts | Energy Circle Diagram
- Draw The Diagram Of A Food Pyramid
- Pyramid Charts | Pyramid Diagram | Pyramid Chart Maker ...