Examples of Flowcharts, Org Charts and More


IDEF0 standard with ConceptDraw DIAGRAM

Entity Relationship Diagram Symbols

Process Flowchart


Account Flowchart. Flowchart Examples

Flowcharting Software

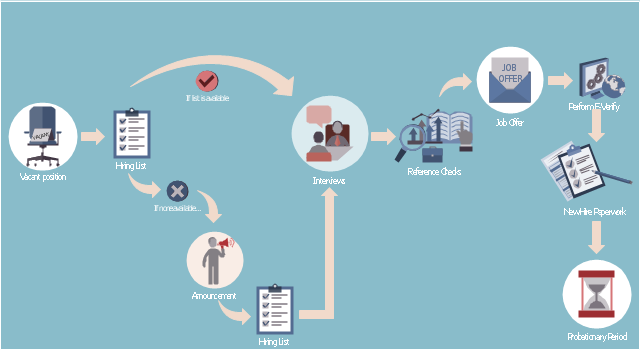
This HR infographics example was designed on the base of flowchart "Hiring Process" from the website of the Idaho Division of Human Resources.
"... hiring process flowchart outlining the steps to fill a vacant position." [dhr.idaho.gov/ hiringprocess.html]
"What is a hiring list and what are they for?
A hiring list consists of applicants who completed and passed the examination for a vacant classified position.
The applicants are ranked on the hiring list in order from highest to lowest score." [dhr.idaho.gov/ PDF%20 documents/ Flowchart/ Hiring%20 List%20 Guidance.pdf]
"Announcements.
Announcing a vacant position benefits the agency by allowing a wide array of applicants the opportunity to compete for job openings, resulting in a more qualified employee. The State Merit System requires all appointments, promotions and separations in the classified service to be based on competence, valid job requirements, and individual performance." [dhr.idaho.gov/ PDF%20 documents/ Flowchart/ Announcement.pdf]
"Conducting A Lawful Employment Interview.
Interviewing prospective employees is one of the most important activities employers do. The employer’s objective of an interview is to determine whether an applicant is suitable for an available position. The interview provides the employer an opportunity to obtain in-depth information about a job applicant’s skills, work history, and employment background for this purpose." [dhr.idaho.gov/ PDF%20 documents/ Flowchart/ Conducting%20 a%20 Lawful%20 Employment%20 Interview.pdf]
"Reference Checks.
References should be checked after a successful interview with a candidate, but before you offer them the position. If after interviewing there are several candidates that are qualified for the position, reference checks are also a way to further distinguish who might best fit within your agency." [dhr.idaho.gov/ PDF%20 documents/ Flowchart/ Reference%20 Checks.pdf]
"Making the job offer.
Before offering the position to your selected candidate, be sure to speak with your HR and fiscal staff. They may have some suggestions for negotiating the starting salary, etc.
Job Offer Letter.
... A job offer letter should be given to the newly hired employee after you have verbally negotiated the terms of employment. This letter confirms the conditions of employment the selected candidate has accepted and gives them information for their first day." [dhr.idaho.gov/ PDF%20 documents/ Flowchart/ Making%20 the%20 job%20 offer.pdf]
"E-verify.
To ensure compliance with the Governor’s Executive Order 2009-10, all
State Agencies are encouraged to participate in E-verify.
E-verify is an internet based system that allows an employer, using information reported on an employee’s Form I-9, to determine the eligibility of that employee to work in the United States.
The E-Verify system is operated by the U.S. Department of Homeland Security in partnership with the Social Security Administration and its use is free of charge to employers." [dhr.idaho.gov/ PDF%20 documents/ Flowchart/ EVerify%20 Statement.pdf]
"New Hire Paperwork.
There are several important forms for the new employee to fill out." [dhr.idaho.gov/ PDF%20 documents/ Flowchart/ New%20 Hire%20 Paperwork.pdf]
"Probationary Period.
All appointments and promotions into classified positions require a probationary period of 1,040 hours
except for peace officers who must serve 2,080 hours.
The probationary period is a working test period to evaluate the work performance of the employee and to determine their suitability for the position." [dhr.idaho.gov/ PDF%20 documents/ Flowchart/ Probationary%20 Period%20 for%20 Hiring%20 Process.pdf]
The HR infographics example "Hiring process workflow" was created using the ConceptDraw PRO diagramming and vector drawing software extended with the HR Flowcharts solution from the Management area of ConceptDraw Solution Park.
HR infographics
Stakeholder Onion Diagrams

KPI Dashboard

Pyramid Diagram

Decision Tree Analysis

The ConceptDraw DIAGRAM diagramming and drawing software is the one that can help with creating the needed drawing, including a decision tree. Making decision tree analysis, it is always easy to make the needed matrix as there are plenty of pre-made templates to be used.
Metropolitan area networks (MAN). Computer and Network Examples
. Computer and Network Examples")

Marketing Plan Infographic

Pie Chart

The vector stencils library "Resources and energy" contains 19 clipart images for drawing illustrations on resources and energy.
"Natural resources occur naturally within environments that exist relatively undisturbed by humanity, in a natural form. A natural resource is often characterized by amounts of biodiversity and geodiversity existent in various ecosystems.
Natural resources are derived from the environment. Some of them are essential for our survival while most are used for satisfying our wants. Natural resources may be further classified in different ways.
Natural resources are materials and components (something that can be used) that can be found within the environment. Every man-made product is composed of natural resources (at its fundamental level). A natural resource may exist as a separate entity such as fresh water, and air, as well as a living organism such as a fish, or it may exist in an alternate form which must be processed to obtain the resource such as metal ores, oil, and most forms of energy." [Natural resource. Wikipedia]
The clip art example "Resources and energy - Vector stencils library" was created in ConceptDraw PRO diagramming and vector drawing software using the Manufacturing and Maintenance solution from the Illustration area of ConceptDraw Solution Park.
Human resources

Batteries

Wind turbine

Transmission tower

Natural gas burner

Solar panel

Lightning

Ionizing radiation hazard sign

High voltage symbol

Atom

Incandescent light bulb

Oil barrels

Power station

Wood

Perpetuum mobile

Hydroelectric dam

Liquefied petroleum gas

Natural gas

Minecart with coal

Organizational Structure Types

PDPC

Authority Matrix Diagram Software

, t chart, decision matrix, decision tree analysis") Decision Making
Decision Making
The Decision Making solution offers the set of professionally developed examples, powerful drawing tools and a wide range of libraries with specific ready-made vector decision icons, decision pictograms, decision flowchart elements, decision tree icons, decision signs arrows, and callouts, allowing the decision maker (even without drawing and design skills) to easily construct Decision diagrams, Business decision maps, Decision flowcharts, Decision trees, Decision matrix, T Chart, Influence diagrams, which are powerful in questions of decision making, holding decision tree analysis and Analytic Hierarchy Process (AHP), visual decomposition the decision problem into hierarchy of easily comprehensible sub-problems and solving them without any efforts.
Business Report Pie. Pie Chart Examples

- Draw A Flow Chart Diagram On Classification Of Resources
- Draw A Chart Of Different Type Of Resources
- Draw A Flow Chart Of Types Of Resources
- Examples of Flowcharts , Org Charts and More | How to Draw a Pie ...
- Draw A Flow Chart Of Resource With Example
- Make A Flow Chart On Types Of Resources
- Examples of Flowcharts , Org Charts and More | Types of Welding in ...
- Prepare The Flow Chart On Classification Of Resources
- Draw A Flowchart Showing Classification Of Resources
- Classification Of Natural Resources With Flow Chart Pdf
- Flowchart On Classification Of Resource
- Classify The Natural Resources In Flowchart
- Resources Flow Chart
- Flow Chart On Classification Of Natural Resources With Eg
- Draw Aflowchart Types Of Resourse
- Types Of Resources In Flowchart
- Draw A Flow Chart To Show How Are Resources Are Classified
- Type Of Natural Resources Flow Chart
- Types of Flowchart - Overview | HR Flowchart Symbols | Human ...