"Targeted advertising is a type of advertising whereby advertisements are placed so as to reach consumers based on various traits such as demographics, psychographics, behavioral variables (such as product purchase history), and firmographic variables ... or other second-order activities which serve as a proxy for these traits.
Most targeted new media advertising currently uses second-order proxies for targeting, such as tracking online or mobile web activities of consumers, associating historical webpage consumer demographics with new consumer web page access, using a search word as the basis for implied interest, or contextual advertising.
Addressable advertising systems serve ads directly based on demographic, psychographic, or behavioral attributes associated with the consumer(s) exposed to the ad. These systems are always digital and must be addressable in that the end point which serves the ad (set-top box, website, or digital sign) must be capable of rendering an ad independently of any other end points based on consumer attributes specific to that end point at the time the ad is served. Addressable advertising systems therefore must use consumer traits associated with the end points as the basis for selecting and serving ads." [Targeted advertising. Wikipedia]
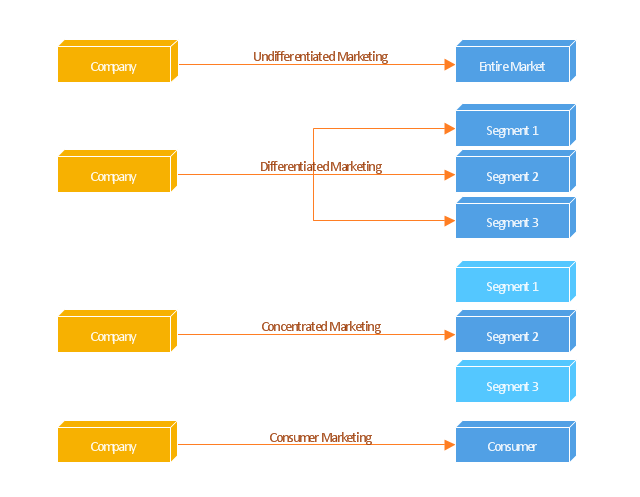
The block diagram example "Marketing targeting" was created using the ConceptDraw PRO diagramming and vector drawing software extended with the Block Diagrams solution from the area "What is a Diagram" of ConceptDraw Solution Park.
Most targeted new media advertising currently uses second-order proxies for targeting, such as tracking online or mobile web activities of consumers, associating historical webpage consumer demographics with new consumer web page access, using a search word as the basis for implied interest, or contextual advertising.
Addressable advertising systems serve ads directly based on demographic, psychographic, or behavioral attributes associated with the consumer(s) exposed to the ad. These systems are always digital and must be addressable in that the end point which serves the ad (set-top box, website, or digital sign) must be capable of rendering an ad independently of any other end points based on consumer attributes specific to that end point at the time the ad is served. Addressable advertising systems therefore must use consumer traits associated with the end points as the basis for selecting and serving ads." [Targeted advertising. Wikipedia]
The block diagram example "Marketing targeting" was created using the ConceptDraw PRO diagramming and vector drawing software extended with the Block Diagrams solution from the area "What is a Diagram" of ConceptDraw Solution Park.
Block diagram
 Block Diagrams
Block diagrams solution extends ConceptDraw DIAGRAM software with templates, samples and libraries of vector stencils for drawing the block diagrams.
Block Diagram Software

UML Class Diagram. Design Elements

 Funnel Diagrams
Funnel Diagrams solution including wide range of funnel diagram samples, sales funnel examples, and vector design elements, makes the ConceptDraw DIAGRAM ideal for funnel management and creation the Funnel Diagrams of different types and designs, AIDA Model, AIDAS, ACCA Dagmar, Rossiter-Percy Model, Sales funnel, Marketing funnel, Search funnel, Brand funnel, Purchase funnel, Lead funnel, Conversion funnel, Business funnel, etc. You are free to choose to place your funnel object horizontally or vertically, you can use the objects with desired quantity of sales funnel stages, as well as to modify their size, color filling, and other parameters to make exceptionally looking Funnel diagrams fully responding to your desires.
UML Composite Structure Diagram


Best Vector Drawing Application for Mac OS X

UML Collaboration Diagram. Design Elements

Example of DFD for Online Store (Data Flow Diagram)


UML Component Diagram. Design Elements

Technical Drawing Software

Flowchart Software


Data Flow Diagram Symbols. DFD Library

IDEF4 Standard

Systems Engineering

Diagramming Software for Design UML Collaboration Diagrams

Types of Flowcharts


 ATM UML Diagrams
The ATM UML Diagrams solution lets you create ATM solutions and UML examples. Use ConceptDraw DIAGRAM as a UML diagram creator to visualize a banking system.
Flowchart Software

 Rapid UML
Rapid UML solution extends ConceptDraw DIAGRAM software with templates, samples and libraries of vector stencils for quick drawing the UML diagrams using Rapid Draw technology.
- Marketing - Design Elements | Marketing - Vector stencils library ...
- Block diagram - Six markets model | Block Diagrams | Block diagram ...
- Block diagram - Porter's five forces model | 5 Level pyramid model ...
- Draw Block Diagram Online
- Block diagram - Marketing targeting
- Block diagram - Marketing targeting | Internet marketing professions ...
- Block diagram - Marketing targeting | Target market | Scatter Chart ...
- Functional Block Diagram | UML Block Diagram | Block Diagram ...
- Block diagram - Marketing targeting | Business diagrams & Org ...
- Marketing Diagrams | Marketing mix - Wheel diagram | Block ...
- Block Diagrams
- Block Diagram
- Advertising creation process - Conversation BPMN 2.0 diagram ...
- Block diagram - Six markets model | Sales Process Flowchart ...
- Internet Marketing Infographic | How to Make a Web Page from ...
- Internet marketing professions | Block diagram - Marketing targeting ...
- Target market - Onion diagram
- Marketing Diagrams | Block diagram - Marketing targeting | Market ...
- Block diagram - Marketing targeting | AD LDS as a phone book ...
- Marketing - Vector stencils library | Rack Diagrams | With The Aid Of ...