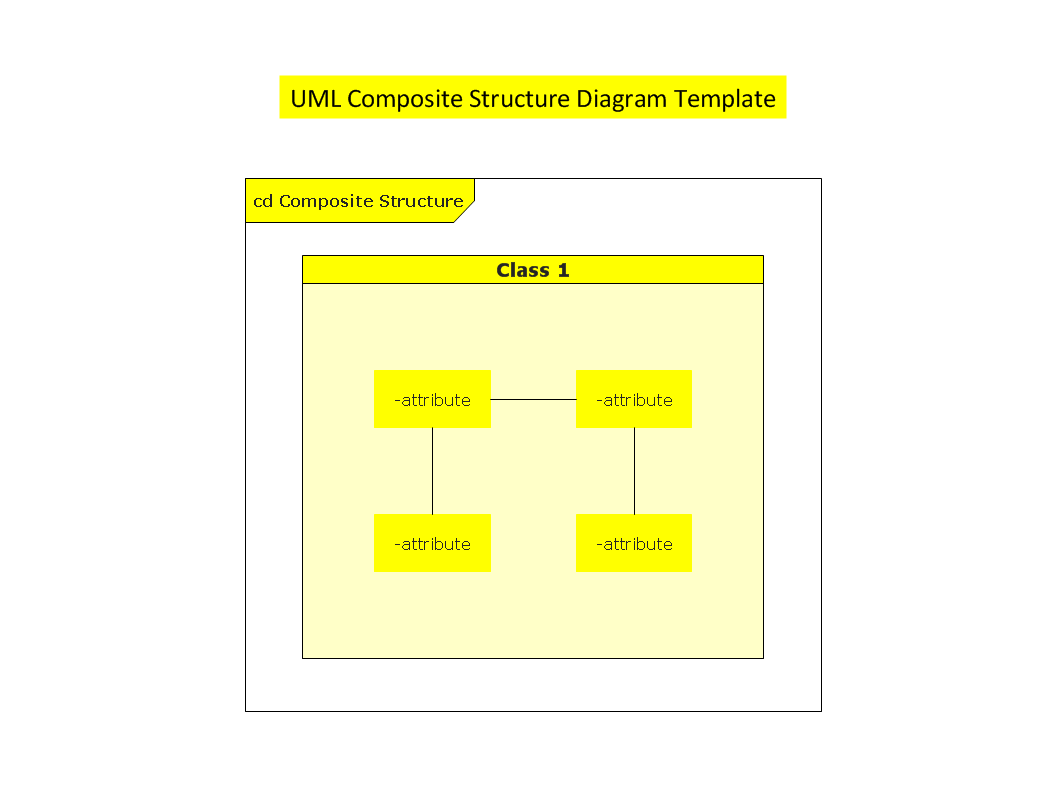
This UML composite structure diagram template is created using ConceptDraw DIAGRAM diagramming and vector drawing software enhanced with Rapid UML solution from ConceptDraw Solution Park.

Rapid UML solution provides templates, examples and libraries of stencils for quick and easy drawing the all types of system and software engineering diagrams according to UML 2.4 notation.
Use ConceptDraw DIAGRAM with UML composite structure diagram templates, samples and stencil library from Rapid UML solution to show the internal structure of a class and the collaborations that this structure makes possible.


TEN RELATED HOW TO's:
ConceptDraw DIAGRAM is perfect for software designers and software developers who need to draw Network Active Directory Diagrams.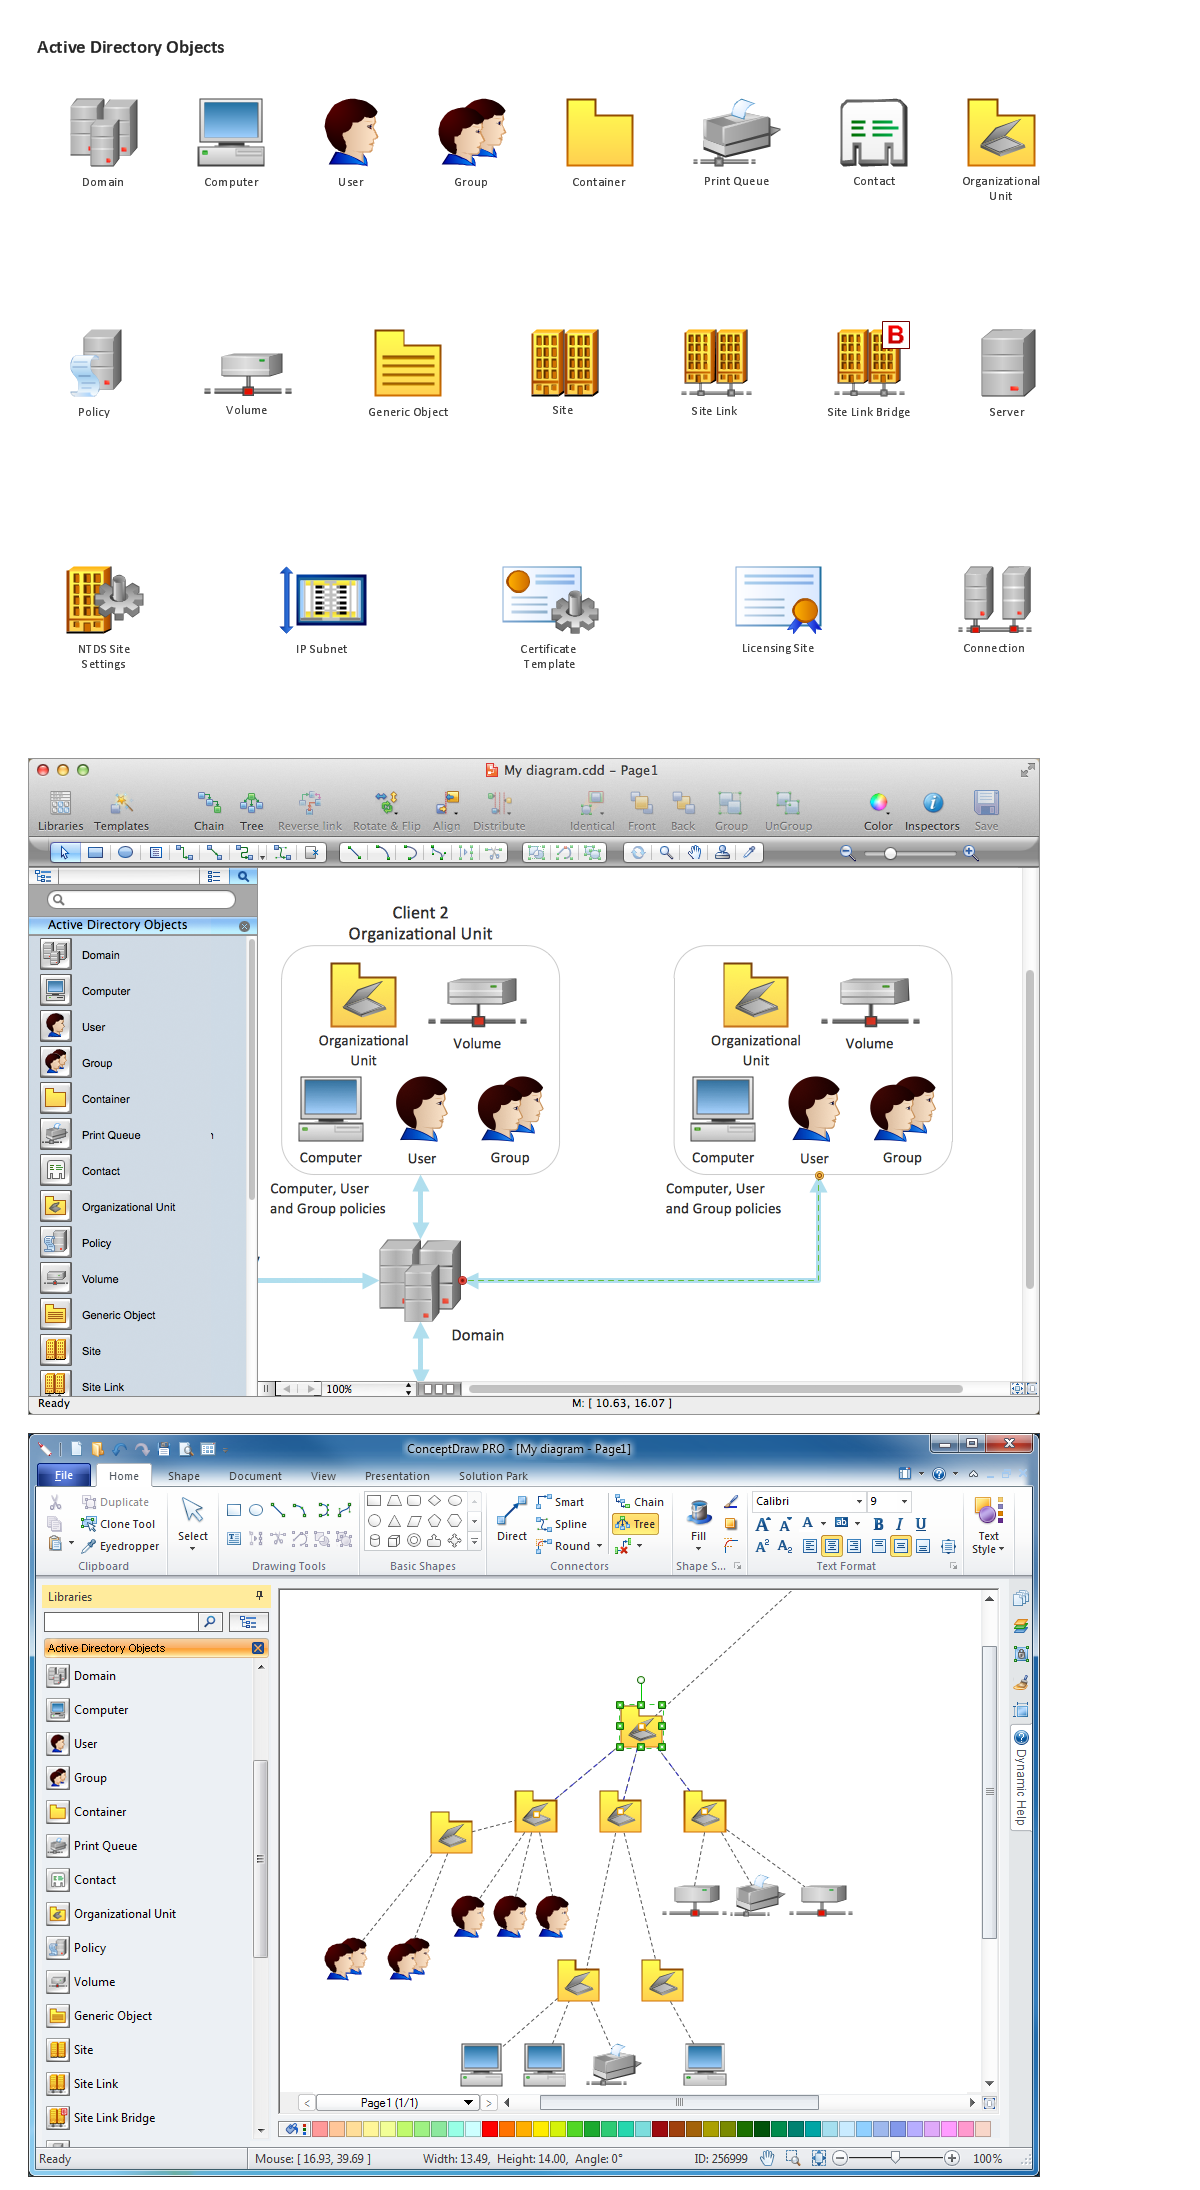
Picture: Network Diagramming Software for Network Active Directory Diagrams
Each business is created, exists and develops according to its type of business structure. Creating new business or developing existing, you may need a powerful software for representing its business structure. In this case ConceptDraw DIAGRAM diagramming and vector drawing software extended with 25 Typical Orgcharts solution from the Management area is exactly what you need.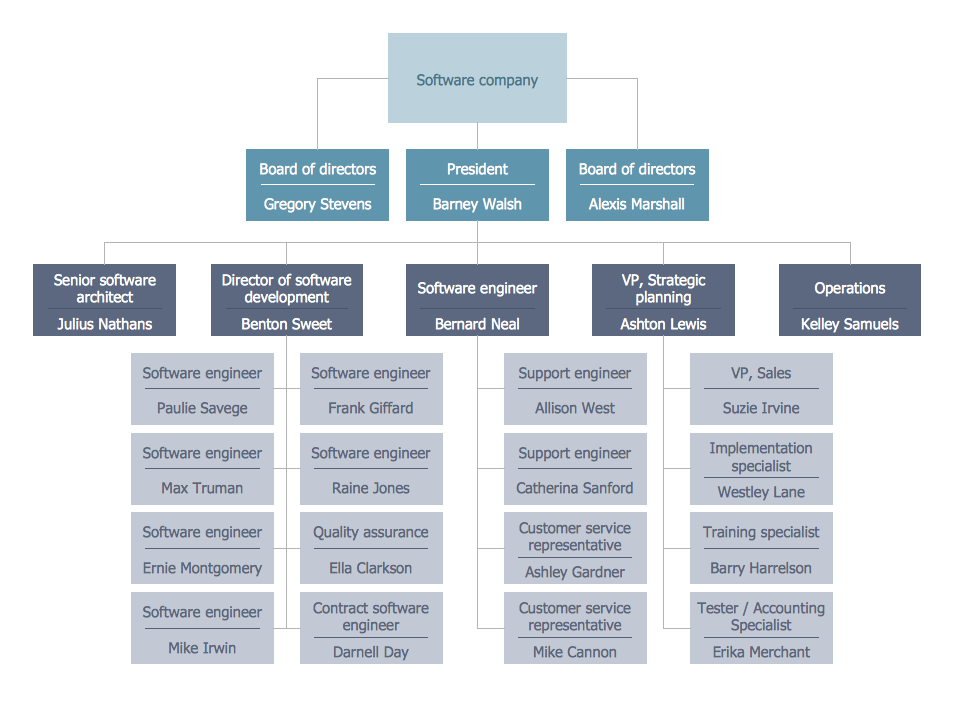
Picture: Business Structure
Related Solution:
A Picture Graph is a popular and widely used type of a bar graph, which represents data in various categories using the pictures.
Picture: Picture Graph
Related Solution:
Network infrastructure planning is a very important process in the network construction, and the share of time allocated to this within the scope of the entire project may reach 60-80%. A competent and thorough approach to planning contributes to the quick investment return, and also increases the reliability and flexibility of the final system, reducing the probability of additional costs related to the incorrect implementation.
Any planning begins with an analysis of the business requirements to the final system. Basic network parameters, which should be assessed are the scalability, accessibility, cost, speed and safety.
Speed and cost are often mistaken for the most important parameters, and the rest of the parameters aren't even remembered. This is not entirely correct. Initially, it is necessary to assess the business plans for the future, because sometimes it is more profitable to invest more money in the beginning. If the business is to develop, then, consequently, demands on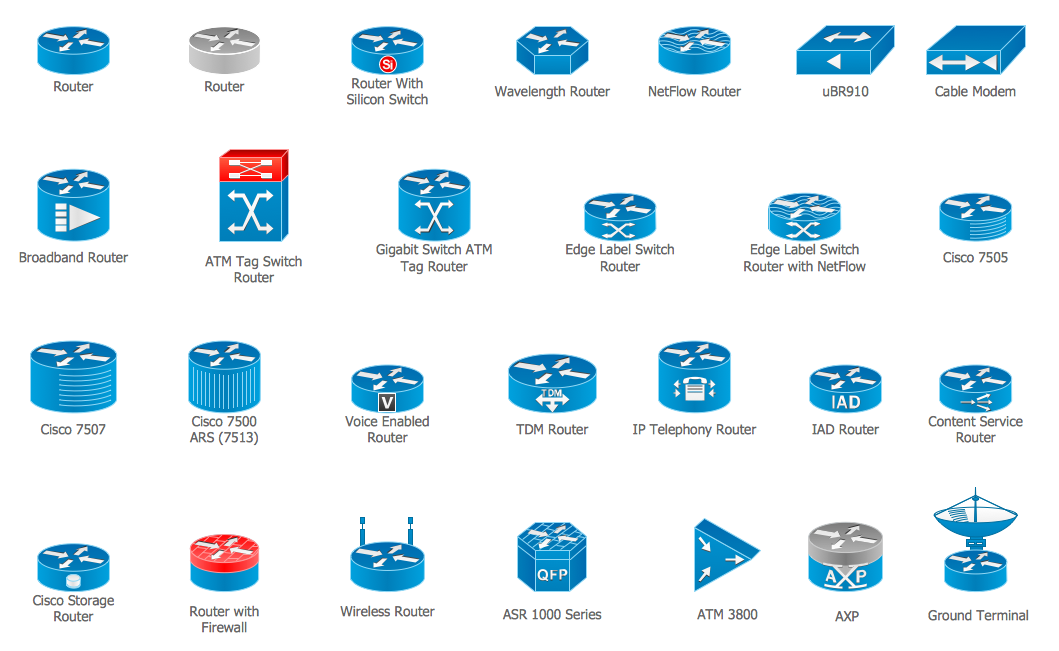
Picture: Cisco Routers. Cisco icons, shapes, stencils and symbols
Related Solution:
UML Interaction Overview Diagram schematically shows a control flow with nodes and a sequence of activities that can contain interaction or sequence diagrams.
Picture: Interaction Overview Diagram
UML Sequence Diagram can be created using ConceptDraw DIAGRAM diagramming software contains rich examples and template. ConceptDraw is perfect for software designers and software developers who need to draw UML Sequence Diagrams.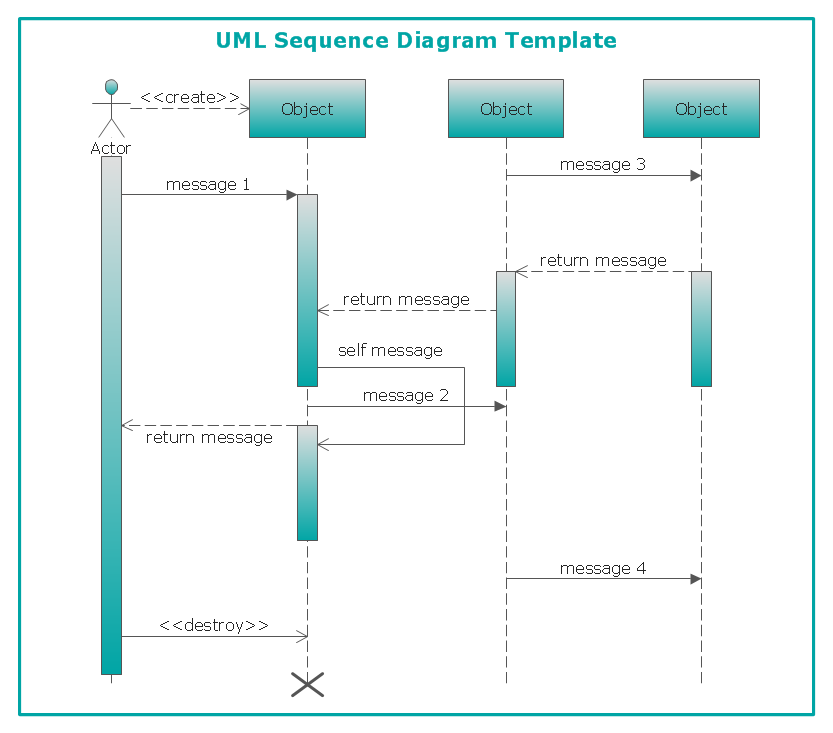
Picture: UML Sequence Diagram
UML Component Diagrams are used to illustrate the structure of arbitrarily complex systems and illustrates the service consumer - service provider relationship between components.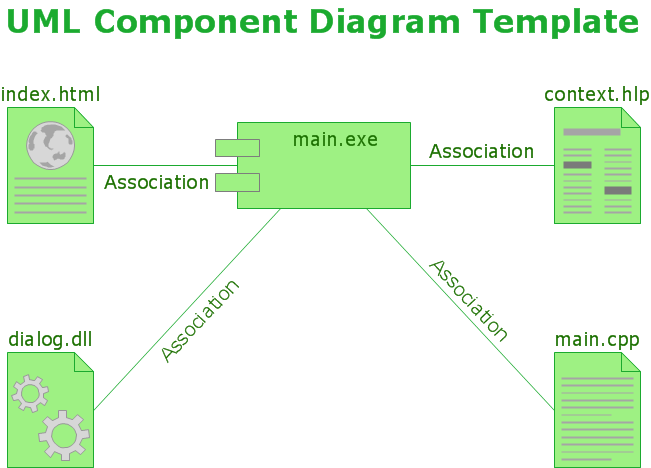
Picture: UML Component Diagram
The UML diagram is a powerful tool which lets visually represent all system's components, the interactions between them and relationships with external user interface.
The Rapid UML solution for ConceptDraw DIAGRAM software offers diversity of UML flowchart symbols for drawing all types of UML diagrams.
Picture: UML Flowchart Symbols
Related Solution:
29095The Data Encryption Standard (DES) is a symmetric-key algorithm for the encryption of the electronic data.
This diagram was created in ConceptDraw DIAGRAM using the Computer and Networks Area of ConceptDraw Solution Park and shows how the encryption and access control work together to secure data.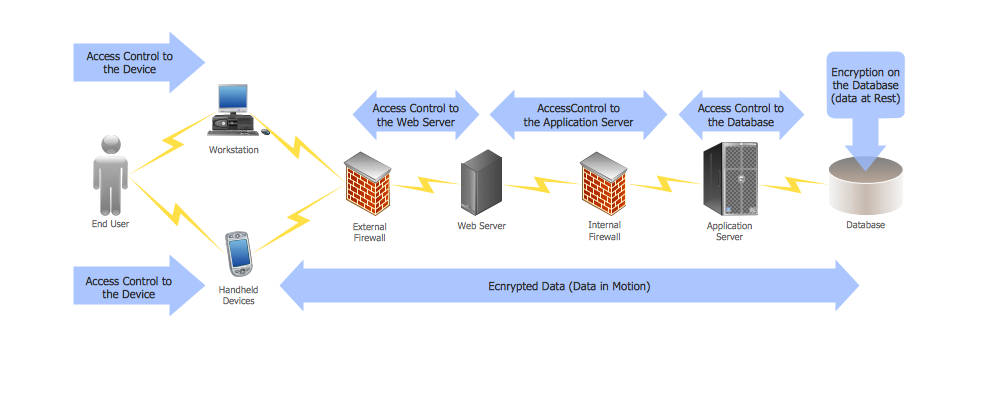
Picture: DES Network. Computer and Network Examples
Related Solution:
The vector stencils library Industrial transport contains clipart of industrial vehicles for ConceptDraw DIAGRAM diagramming and vector drawing software.
Use it to draw illustrations of industrial vehicles, transportation, lifting and moving materials using machines.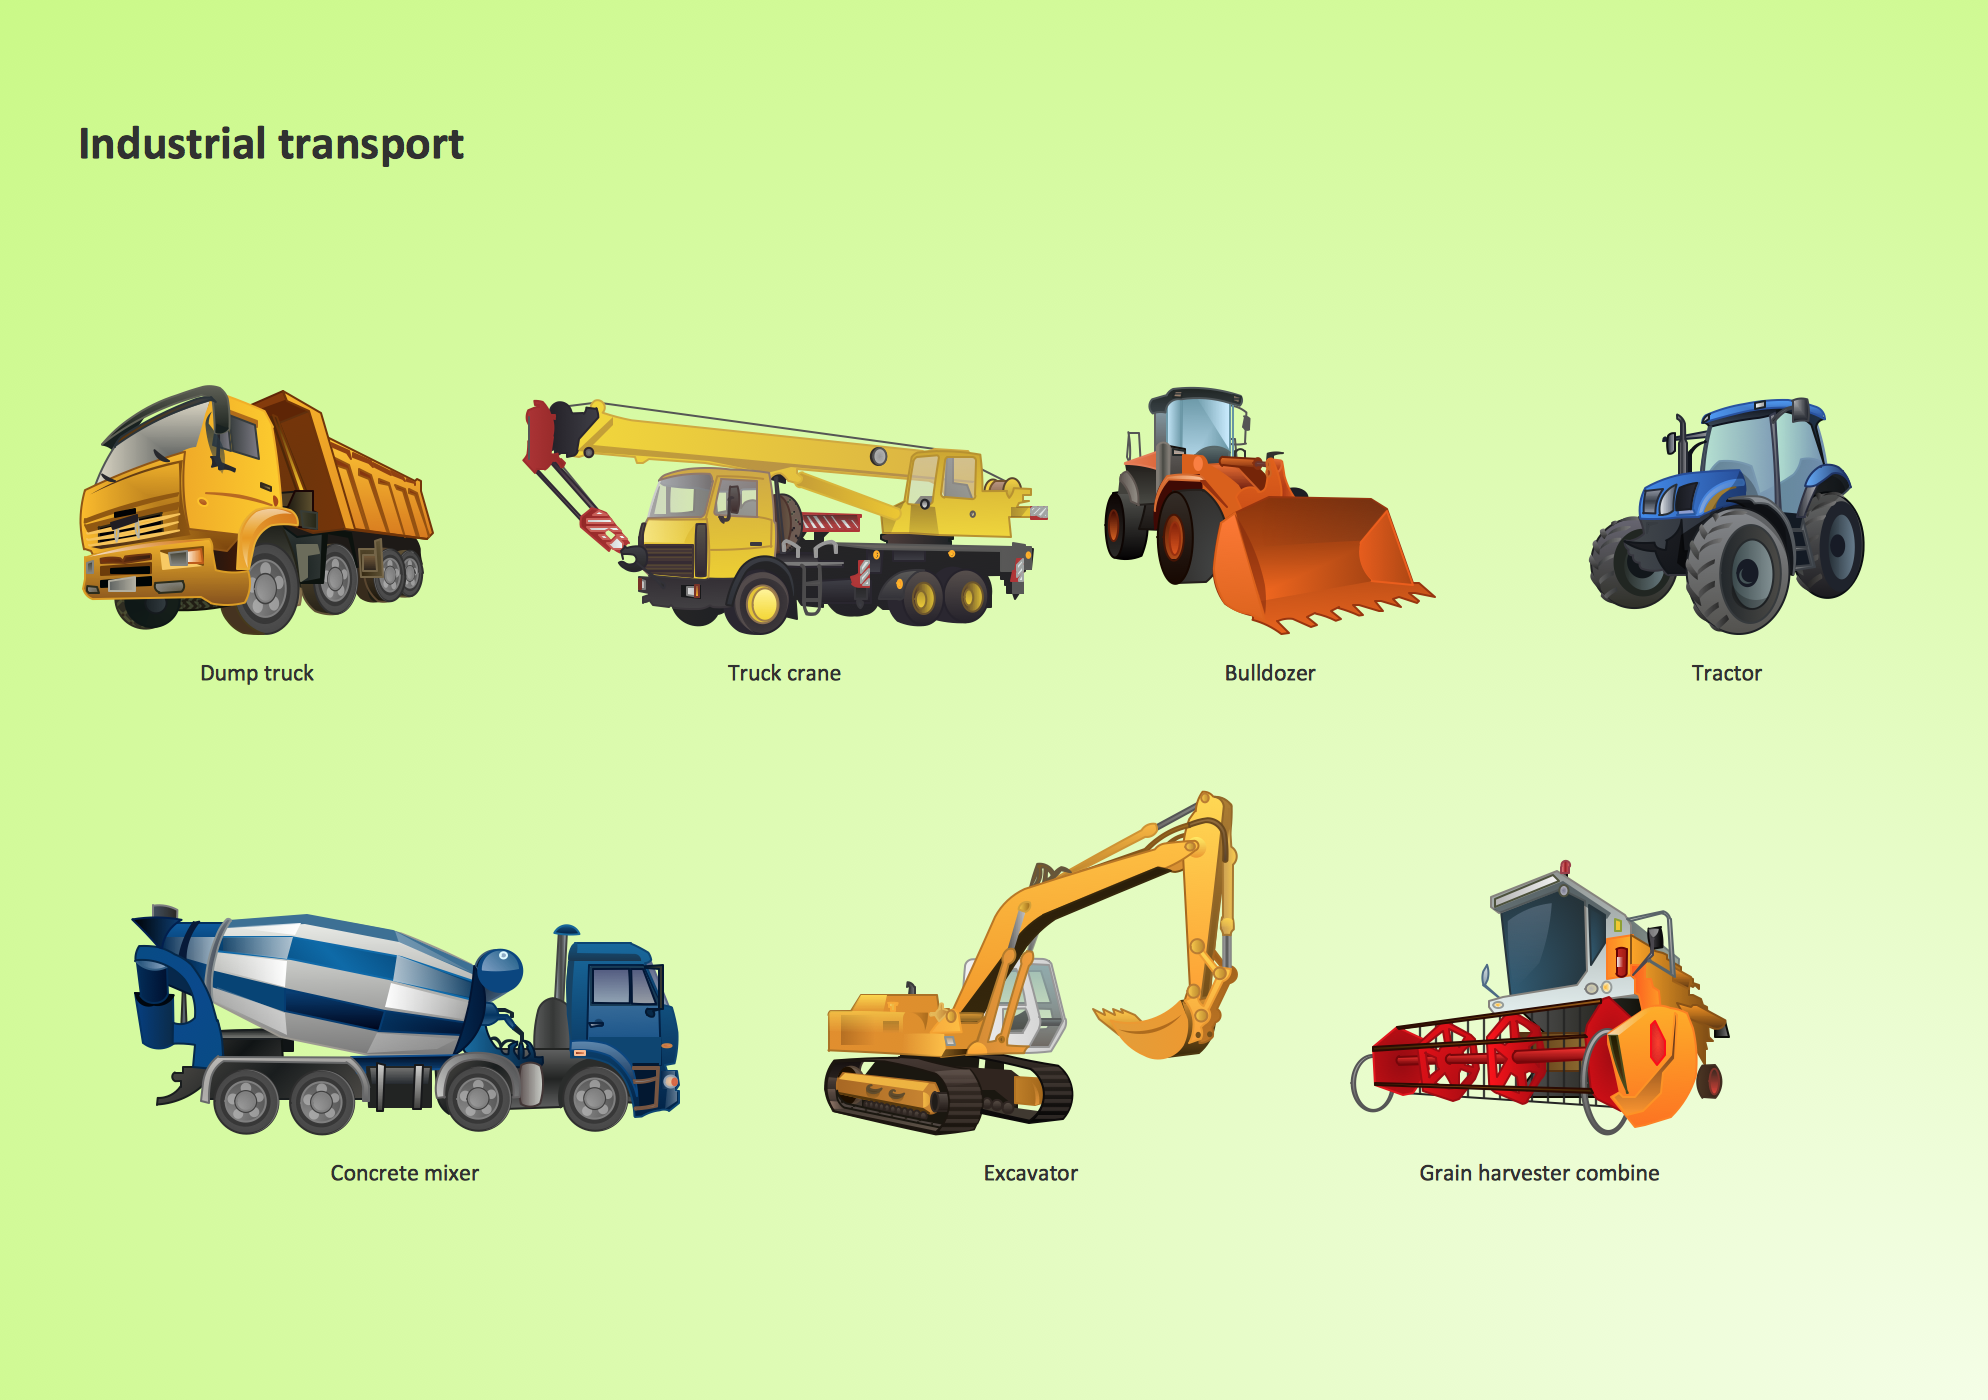
Picture: Industrial transport - Design elements
Related Solution:


