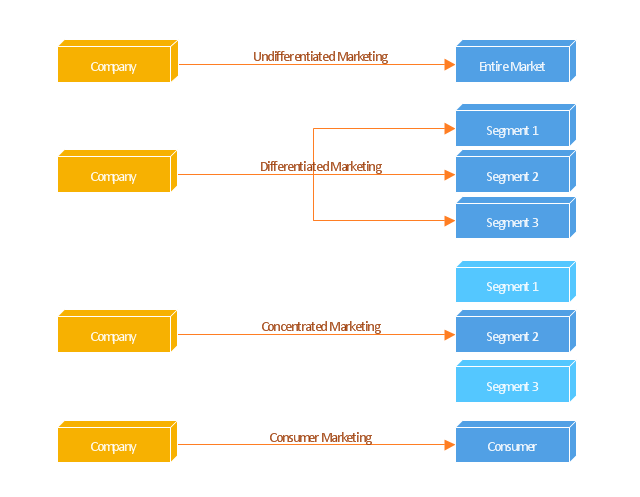
"Targeted advertising is a type of advertising whereby advertisements are placed so as to reach consumers based on various traits such as demographics, psychographics, behavioral variables (such as product purchase history), and firmographic variables ... or other second-order activities which serve as a proxy for these traits.
Most targeted new media advertising currently uses second-order proxies for targeting, such as tracking online or mobile web activities of consumers, associating historical webpage consumer demographics with new consumer web page access, using a search word as the basis for implied interest, or contextual advertising.
Addressable advertising systems serve ads directly based on demographic, psychographic, or behavioral attributes associated with the consumer(s) exposed to the ad. These systems are always digital and must be addressable in that the end point which serves the ad (set-top box, website, or digital sign) must be capable of rendering an ad independently of any other end points based on consumer attributes specific to that end point at the time the ad is served. Addressable advertising systems therefore must use consumer traits associated with the end points as the basis for selecting and serving ads." [Targeted advertising. Wikipedia]
The block diagram example "Marketing targeting" was created using the ConceptDraw PRO diagramming and vector drawing software extended with the Block Diagrams solution from the area "What is a Diagram" of ConceptDraw Solution Park.
Block diagram
Business diagrams & Org Charts with ConceptDraw DIAGRAM


HelpDesk
How to Make a Web Page from Infographics

 Telecommunication Network Diagrams
Telecommunication Network Diagrams solution extends ConceptDraw DIAGRAM software with samples, templates, and great collection of vector stencils to help the specialists in a field of networks and telecommunications, as well as other users to create Computer systems networking and Telecommunication network diagrams for various fields, to organize the work of call centers, to design the GPRS networks and GPS navigational systems, mobile, satellite and hybrid communication networks, to construct the mobile TV networks and wireless broadband networks.
 AWS Architecture Diagrams
AWS Architecture Diagrams with powerful drawing tools and numerous predesigned Amazon icons and AWS simple icons is the best for creation the AWS Architecture Diagrams, describing the use of Amazon Web Services or Amazon Cloud Services, their application for development and implementation the systems running on the AWS infrastructure. The multifarious samples give you the good understanding of AWS platform, its structure, services, resources and features, wide opportunities, advantages and benefits from their use; solution’s templates are essential and helpful when designing, description and implementing the AWS infrastructure-based systems. Use them in technical documentation, advertising and marketing materials, in specifications, presentation slides, whitepapers, datasheets, posters, etc.
HelpDesk
How to Publish Project Reports to a Web Site

HelpDesk
How to Save a Diagram as a Web Page

Business Process Modeling Notation

 ConceptDraw Solution Park
ConceptDraw Solution Park collects graphic extensions, examples and learning materials
Pyramid Diagram

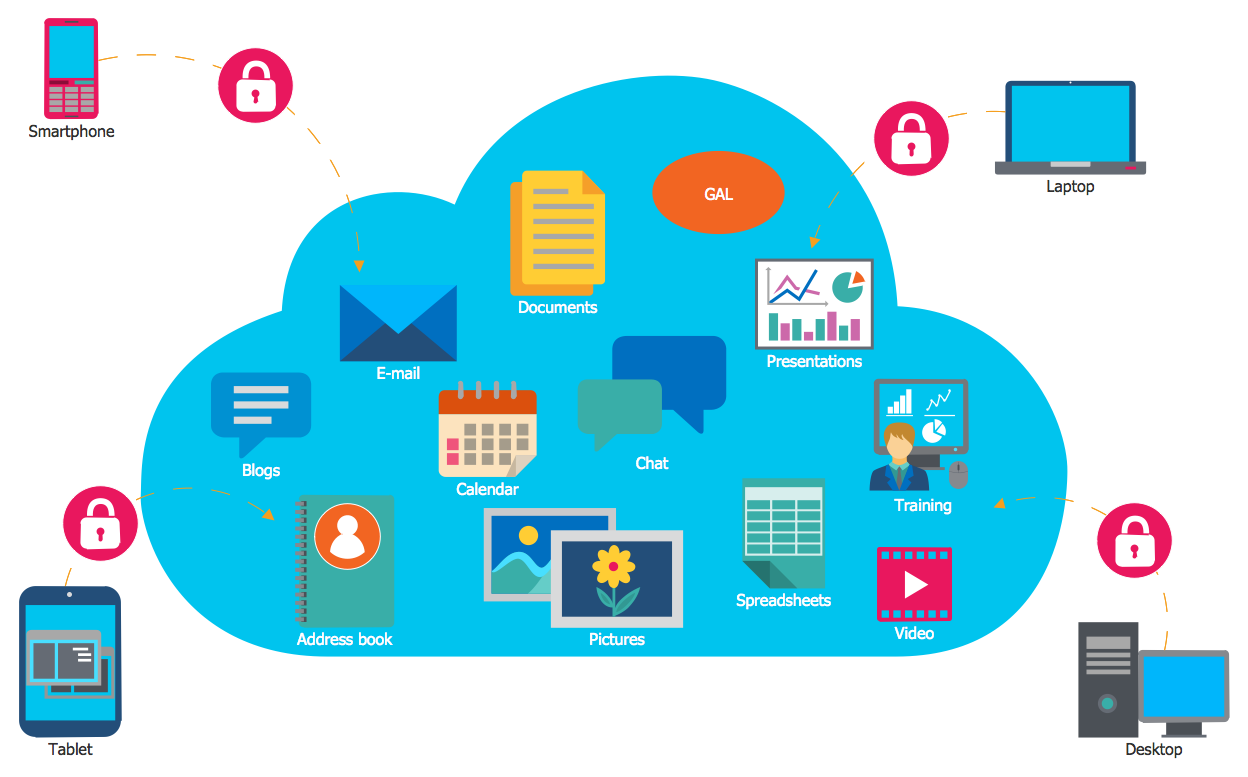
Cloud Computing
HelpDesk
How to Make a Web Page from Your Metro Map

Six Markets Model Chart

 Event-driven Process Chain Diagrams
Event-Driven Process Chain Diagrams solution extends ConceptDraw DIAGRAM functionality with event driven process chain templates, samples of EPC engineering and modeling the business processes, and a vector shape library for drawing the EPC diagrams and EPC flowcharts of any complexity. It is one of EPC IT solutions that assist the marketing experts, business specialists, engineers, educators and researchers in resources planning and improving the business processes using the EPC flowchart or EPC diagram. Use the EPC solutions tools to construct the chain of events and functions, to illustrate the structure of a business process control flow, to describe people and tasks for execution the business processes, to identify the inefficient businesses processes and measures required to make them efficient.
- Circle-spoke diagram - Proximity based marketing | Circle-spoke ...
- Internet marketing - Concept map | Venn diagram - Internet ...
- Block diagram - Marketing targeting | Venn diagram - Internet ...
- Venn diagram - Internet marketing professions | Internet Connectivity ...
- Marketing Diagrams | Marketing Analysis Diagram | Marketing mix ...
- Marketing mix - Wheel diagram | Marketing Analysis Diagram ...
- Marketing Diagrams | Target and Circular Diagrams | Marketing ...
- Internet marketing - Concept map | Venn diagram - Internet ...
- Marketing Diagrams | Target and Circular Diagrams | Block diagram ...
- Marketing Diagrams | Marketing mix - Wheel diagram | Venn ...
- Diagram Of Targeted Marketing
- Venn diagram - Internet marketing professions | Wireless Networks ...
- Pyramid Diagram | Block diagram - Marketing targeting | Time ...
- Internet marketing - Concept map | Concept Maps | What Is a ...
- Venn diagram - Internet marketing professions | Local area network ...
- Advertising creation process - Conversation BPMN 2.0 diagram ...
- Block Diagram Of Marketing On The Web
- Piechart On Web Based Marketing
- Venn diagram - Internet marketing professions | Marketing Diagrams ...
- Block diagram - Marketing targeting