 Basic Pie Charts
This solution extends the capabilities of ConceptDraw PRO v10.3.0 (or later) with templates, samples, and a library of vector stencils for drawing pie and donut charts.
 Target and Circular Diagrams
This solution extends ConceptDraw PRO software with samples, templates and library of design elements for drawing the Target and Circular Diagrams.
 ConceptDraw Solution Park
ConceptDraw Solution Park collects graphic extensions, examples and learning materials
HelpDesk
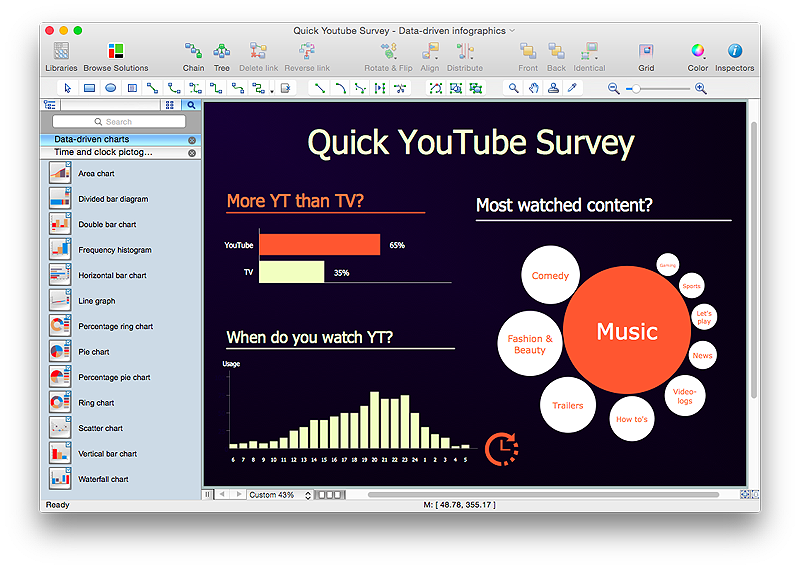
How to Create Data-driven Infographics
Data-driven infographics are used in wildly disparate areas of business and commerce. To make effective Data-driven infographics, it's useful to have a wide variety of graphical elements — icons, clipart, stencils, charts and graphs — to illustrate your diagram. ConceptDraw Data-driven Infographics solution provides all the tools you need to present data as described by this article — as well as the charts mentioned previously, you can find histograms, divided bar charts, ring charts, line graphs and area charts — meaning you can find the perfect medium for displaying a certain type of data. It allows you to draw data driven infographics quickly and easily using the special templates and vector stencils libraries.It can be used to quickly communicate a message, to simplify the presentation of large amounts of data, to see data patterns and relationships, and to monitor changes in variables over time.Diagram Software - The Best Choice for Diagramming
For vector shapes and connector tools for quick and easy drawing diagrams for business, technology, science and education - The best choice for Diagramming is ConceptDraw PRO.
 Sales Dashboard
Sales Dashboard solution extends ConceptDraw PRO software with templates, samples and library of vector stencils for drawing the visual dashboards of sale metrics and key performance indicators (KPI).
- Marketing Pie Chart
- How to Create a Pie Chart | Pyramid Chart Examples | Donut Chart ...
- Content marketing cycle - Diamond pie chart | Content marketing ...
- How to Create a Pie Chart | Pyramid Chart Examples | Pie Chart ...
- Pie Chart Examples In Statistics Based On Investment
- Internet marketing - Concept map | The Best Flowchart Software ...
- Proximity based marketing
- Competitor Analysis | Marketing Plan Infographic | Bar Chart ...
- Content marketing cycle - Diamond pie chart | Process Flowchart ...
- Information Transfer Pie Chart
- Circular diagrams - Vector stencils library | Circular Diagram ...
- Content Marketing Infographics | Content marketing cycle - Ring ...
- Pie Chart Marketing Mix Products
- Pie Chart Examples and Templates | Basic Flowchart Symbols and ...
- Pie Chart Software | How to Create a Picture Graph in ConceptDraw ...
- How to Draw a Pie Chart Using ConceptDraw PRO | Examples of ...
- Pie Chart Examples and Templates | Best Diagramming | Pie Charts ...
- Circle Spoke Diagram Template | Best Diagramming | UML Class ...
- Examples of Flowcharts, Org Charts and More | Bar Chart Examples ...
- Enterprise dashboard | Pie Chart Of The Current Trends In Human ...

