"Microsoft SharePoint is a Web application platform developed by Microsoft. First launched in 2001, SharePoint has historically been associated with intranet, content management and document management, but recent versions have significantly broader capabilities.
SharePoint comprises a multipurpose set of Web technologies backed by a common technical infrastructure. By default, SharePoint has a Microsoft Office-like interface, and it is closely integrated with the Office suite. The web tools are designed to be usable by non-technical users. SharePoint can be used to provide intranet portals, document & file management, collaboration, social networks, extranets, websites, enterprise search, and business intelligence. It also has system integration, process integration, and workflow automation capabilities.
Enterprise application software (e.g. ERP or CRM packages) often provide some SharePoint integration capability, and SharePoint also incorporates a complete development stack based on web technologies and standards-based APIs. As an application platform, SharePoint provides central management, governance, and security controls for implementation of these requirements. The SharePoint platform integrates directly into IIS - enabling bulk management, scaling, and provisioning of servers, as is often required by large organizations or cloud hosting providers." [Microsoft SharePoint. Wikipedia]
The AWS architecture diagram example "SharePoint server reference architecture for public-facing website scenario" was created using the ConceptDraw PRO diagramming and vector drawing software extended with the AWS Architecture Diagrams solution from the Computer and Networks area of ConceptDraw Solution Park.
AWS architecture diagram

Basic Flowchart Symbols and Meaning


Workflow Diagram Examples

Software Diagrams

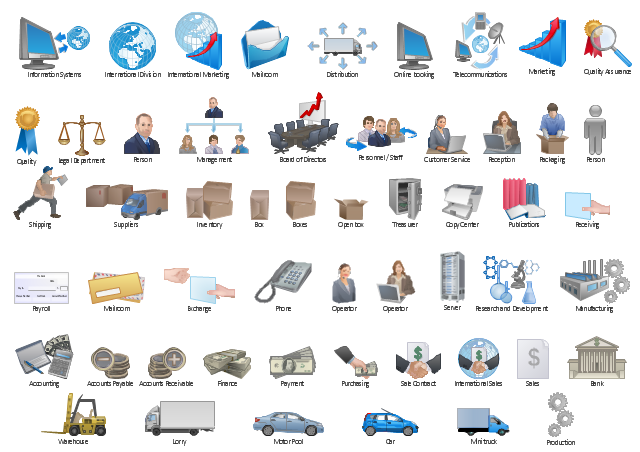
The vector stencils library "Workflow diagrams" contains 54 symbol icons for drawing the work flow charts.
Use these clipart to represent information flow, automation of business processes, business process re-engineering, accounting, management, and human resources tasks in industry, business, and manufacturing.
"A workflow consists of an orchestrated and repeatable pattern of business activity enabled by the systematic organization of resources into processes that transform materials, provide services, or process information. It can be depicted as a sequence of operations, declared as work of a person or group, an organization of staff, or one or more simple or complex mechanisms.
From a more abstract or higher-level perspective, workflow may be a view or representation of real work, thus serving as a virtual representation of actual work. The flow being described may refer to a document, service or product that is being transferred from one step to another.
Workflows may be viewed as one fundamental building block to be combined with other parts of an organisation's structure such as information silos, teams, projects, policies and hierarchies." [Workflow. Wikipedia]
The clipart example "Design elements - Workflow diagram" was drawn using the ConceptDraw PRO diagramming and vector drawing software extended with the Workflow Diagrams solution from the Business Processes area of ConceptDraw Solution Park.
Workflow symbols
Drawing Workflow Diagrams

Software development with ConceptDraw DIAGRAM

Types of Flowcharts


What is a Cross Functional Flow Chart?

 Business Process Workflow Diagrams
The Business Process Workflow Diagrams solution enhances the ConceptDraw DIAGRAM functionality with predesigned examples, samples and a numerous collection of predesigned vector objects of workflow chart elements, icons, arrows, connectors, and varied wor
Types of Flowchart - Overview

Balanced Scorecard Software

How to Build Cloud Computing Diagram Principal Cloud Manufacturing

Microsoft Azure

Cross Functional Diagram

Standard Shapes for Value Stream Mapping

Design Pictorial Infographics. Design Infographics

Business Diagram Software


Cross Functional Flowchart for Business Process Mapping

Collaboration in a Project Team

- Basic Flowchart Symbols and Meaning | Workflow Diagram ...
- Basic Flowchart Symbols and Meaning | Flow chart Example ...
- Automated Workflow
- Data Flow Diagram | Basic Flowchart Symbols and Meaning ...
- Data Flow Diagram | Basic Flowchart Symbols and Meaning ...
- Block diagram - Document management system architecture | AWS ...
- Block Diagrams | Automated payroll management system UML ...
- Process Flowchart | Basic Flowchart Symbols and Meaning | FSM ...
- Block diagram - Document management system architecture | Block ...
- Data Flow Diagram | DFD Library System | Process Flowchart | Data ...
- Process Flowchart | Flow chart Example. Warehouse Flowchart ...
- Models Of Office Automation System
- Basic Flowchart Symbols and Meaning | Process Flowchart | Data ...
- UML Activity Diagram | UML Diagram of Parking | Process Flowchart ...
- Process Flowchart | Production Of Canteen Automation System
- Process Flowchart | Workflow Diagram | Basic Flowchart Symbols ...
- Basic Flowchart Symbols and Meaning | Business Process ...
- Web Workflow Software
- Design elements - Workflow diagram | Design elements - Scrum ...
- Automated payroll management system UML activity diagram | 4 ...