
Example 1. Cross Functional Diagram - Order Processing
Use ConceptDraw STORE to quickly get the access for extensive Cross-Functional Flowcharts Solution tools.

Example 2. Cross-Functional Flowcharts Solution in ConceptDraw STORE
The simplest way for creating the Cross Functional Diagram is to open the sample which the best meets your needs, and simply change and improve it. Or you can create the new document and use the ready predesigned vector objects from the Cross-Functional Diagrams library.

Example 3. Cross Functional Diagram - Replacing Engine Oil
This sample was created in ConceptDraw DIAGRAM using the Cross-Functional Flowcharts Solution from the Business Processes Area and shows the Cross Functional Diagram for replacing engine oil. How is it easy create so complex Cross Functional Diagram using the predesigned vector stencils from the Cross-Functional Flowcharts library. An experienced user spent 20 minutes creating this sample.
Use the Cross-Functional Flowcharts Solution for ConceptDraw DIAGRAM to create your own Cross Functional Diagram in a few minutes and then successfully use it in your work activity.
All source documents are vector graphic documents. They are available for reviewing, modifying, or converting to a variety of formats (PDF file, MS PowerPoint, MS Visio, and many other graphic formats) from the ConceptDraw STORE. The Cross-Functional Flowcharts Solution is available for all ConceptDraw DIAGRAM or later users.
TEN RELATED HOW TO's:
A cozy atmosphere is crucial for the success of any cafe or restaurant. To provide it, you should use restaurant floor plan software at the stage of design. If your establishment is located conveniently and has a harmonic atmosphere inside it, this is bound to be a success.
This sample Restaurant floor plan illustrates the possibilities of ConceptDraw solution for Cafe and Restaurant plans. It represents the location of the restaurant's main hall with its furnishing as well as a plan of kitchen and toilets. Generally, Cafe and Restaurant Plans solution has a big set vector images of tables, seats, lightening, etc. Using them you will be able to plan the restaurant of your desire with an incredible design and spirit.
Picture: Restaurant Floor Plan Software
Related Solution:
This sample shows the Flowchart that displays the architecture of SQL Exception Translation.
This sample was created in ConceptDraw DIAGRAM diagramming and vector drawing software using the Flowcharts solution from the Diagrams area of ConceptDraw Solution Park.
Picture: Sample Project Flowchart. Flowchart Examples
Related Solution:
ConceptDraw DIAGRAM diagramming and vector drawing software extended with Marketing Diagrams Solution from the Marketing Area of ConceptDraw Solution Park is the best software for quick and easy creating Marketing Flow Chart of any complexity and design.
Picture: Marketing Flow Chart
Related Solution:
When searching for a diagramming tool, we look for a powerful and reliable software that would be easy to use. To mention one, ConceptDraw DIAGRAM has all the necessary features to create cross-functional flowcharts (Swim Lanes) quick and effortlessly. You can draw swim lane diagrams in both vertical and horizontal ways.
This cross-functional flowchart displays a payroll process. It explains to each participant his role in the process depending on the category, represented with swimlanes. Using this flowchart, every employee can easily find out what he can expect in terms of salary. Generally a cross-functional diagram enables one to take a look at processes with a wider scope and with more precision than simple flowchart. Business process capturing using cross-functional flowcharts can be useful for stakeholders and managers to define clearly the staff's roles and responsibilities.
Picture: Cross-Functional Flowchart (Swim Lanes)
Related Solution:
ConceptDraw DIAGRAM Comparison with Omnigraffle Professional and MS Visio. All source ConceptDraw documents are vector graphic documents. They are available for reviewing, modifying, or converting to a variety of formats: PDF file, MS PowerPoint, MS Visio, and many other graphics formats.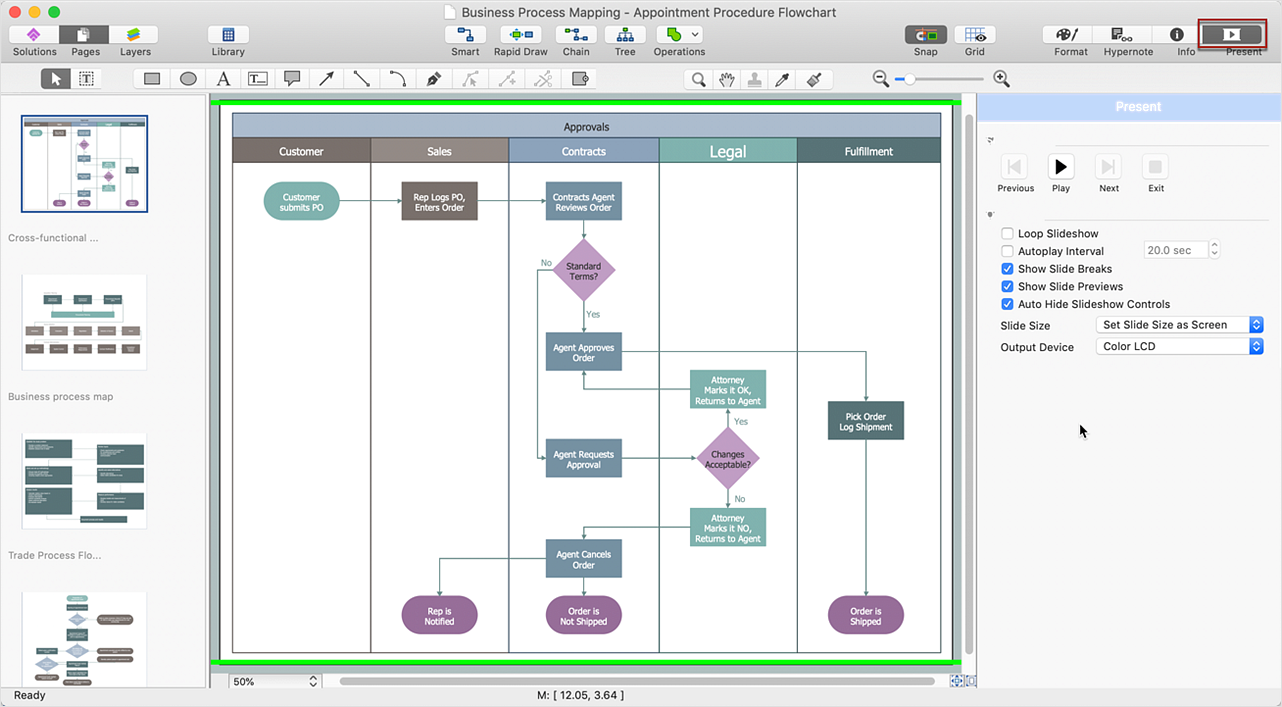
Picture: ConceptDraw DIAGRAM Comparison with Omnigraffle Professional and MS Visio
Related Solution:
A process flow chart is a sequence diagram on events, actions, tasks and decisions that are visualized in a form of inputs and outputs. Such flow chart involves a defined number of standard symbols and notation keys used to help one understand and pass the information.
Process flow charts have become a day-to-day tool for chemical engineers, technologists and production engineers as well as software developers. However, their use has recently increased in other areas such as business, manufacturing and, especially a service sector.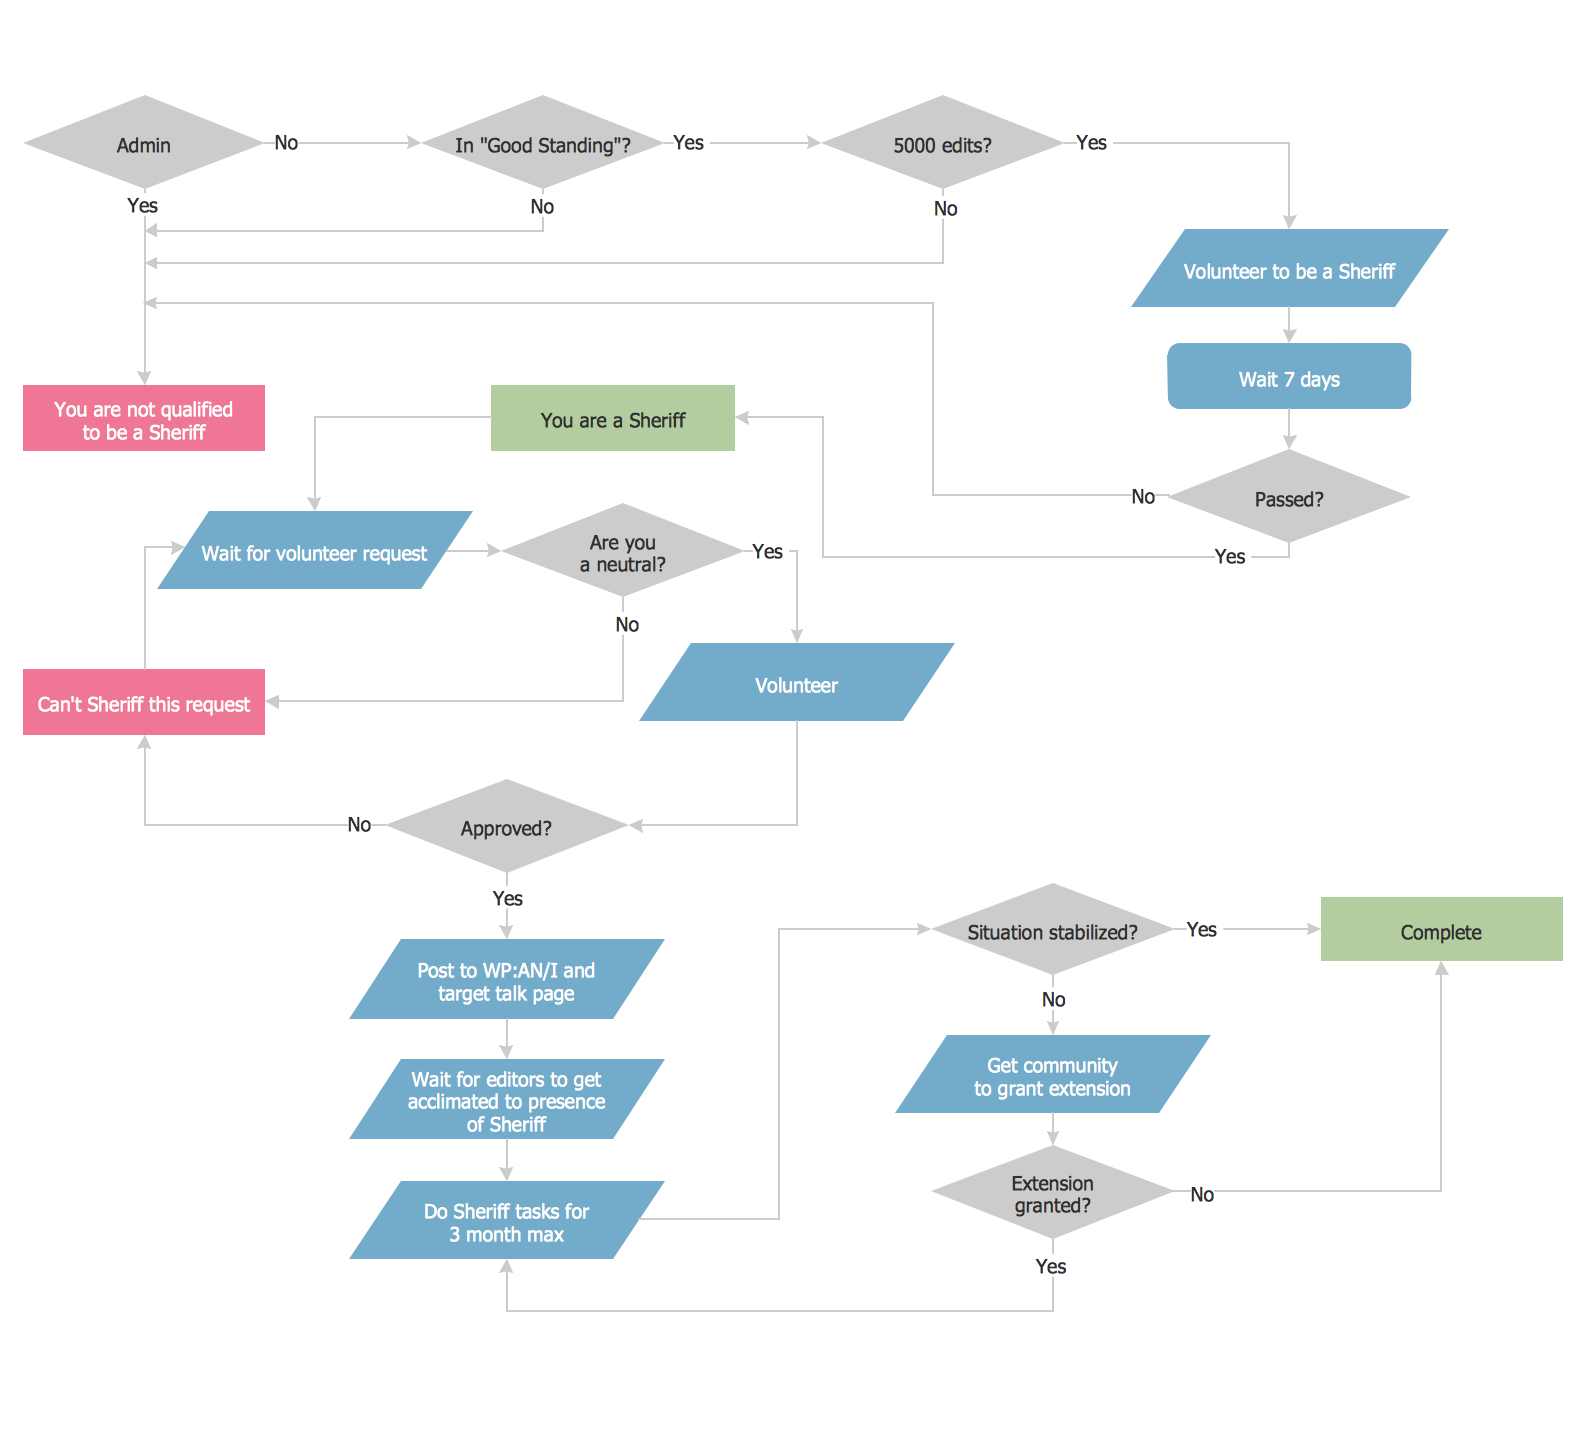
Picture: Example Process Flow Chart
Related Solution:
For documenting the Cloud Computing Architecture with a goal to facilitate the communication between stakeholders are successfully used the Cloud Computing Architecture diagrams. It is convenient and easy to draw various Cloud Computing Architecture diagrams in ConceptDraw DIAGRAM software with help of tools of the Cloud Computing Diagrams Solution from the Computer and Networks Area of ConceptDraw Solution Park.
Picture: Cloud Computing Architecture Diagrams
Related Solution:
The Value Stream Map (VSM) is one of the most common lean management tools. ConceptDraw DIAGRAM diagramming and vector drawing software supplied with Value Stream Mapping solution is ideal for drawing Value Stream Maps. Value Stream Mapping solution from the Quality area of ConceptDraw Solution Park includes a variety of value stream mapping examples.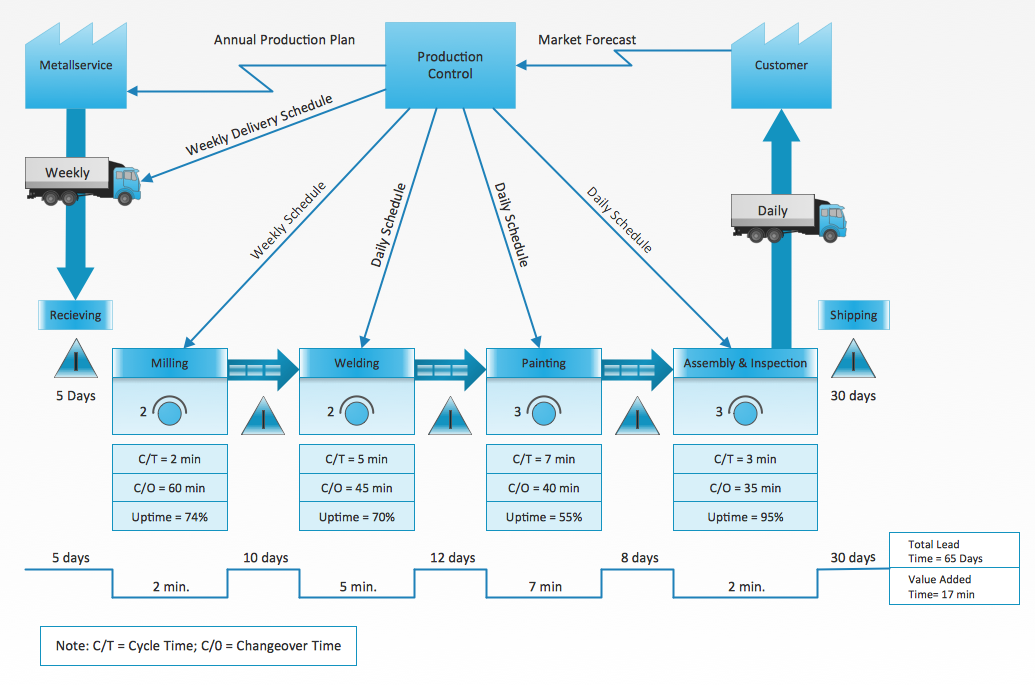
Picture: Value Stream Mapping Examples
Related Solution:
This sample shows the Flowchart that displays the process of the achievement the consensus, in other words solving for the acceptable solution.
This Flowchart has start point. The rectangles on it represent the steps of the process and are connected with arrows that show the sequence of the actions. The diamonds with yes/no shows the decisions. The Flowcharts are widely used in marketing, business, analytics, government, politics, engineering, architecture, science, manufacturing, administration, etc.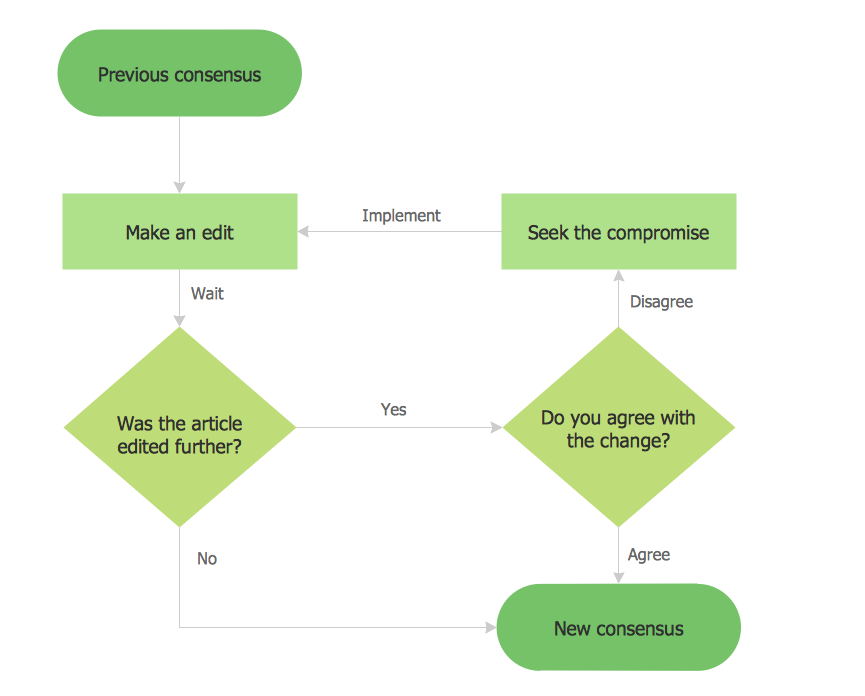
Picture: Example Basic Flowchart. Flowchart Examples
Related Solution:
Do you like the professional schemes that you can find on the Internet? Take into account that the most part of them is made using the Best Flowchart Software and Flowchart Symbols. Try you own powers in creating such diagrams!
Flowcharts are the most business diagramming tool. If you are a business manager, you can use flow chart to depict work flow in your organization, develop the effective organizational structure and present the information to investors or other stakeholders. Combining the smart management solutions with ConceptDraw DIAGRAM diagramming engine delivers the set of comprehensive flowchart tools necessary to support professionals in their creativeness and business activity.
Picture: Best Flowchart Software and Flowchart Symbols
Related Solution:

