PROBLEM ANALYSIS. Relations Diagram

ConceptDraw Office suite is a software for relation diagram making.

Relationships Analysis

The Seven Management and Planning Tools is a tool for Interaction diagram drawing. This diagram identifies causal relationships. Determine what factors are causes and which factors are effects. Interaction diagram helps establish KPIs to monitor changes and the effectiveness of corrective actions in resolving the problem.
 Seven Management and Planning Tools
Seven Management and Planning Tools solution extends ConceptDraw PRO and ConceptDraw MINDMAP with features, templates, samples and libraries of vector stencils for drawing management mind maps and diagrams.
Cause and Effect Analysis - Fishbone Diagrams for Problem Solving

PROBLEM ANALYSIS. Identify and Structure Factors

ConceptDraw Office suite is a software for identify and structure factors with affinity diagram. This is a grouping and structuring of factors that impact on a problem.
When To Use a Fishbone Diagram

When to use a Fishbone diagram? Originally developed as a quality control tool, you may find a Fishbone diagram helpful when used in many cases, such as to analyze a complex problem when there are many causes, for identifying all possible root causes for an effect or a problem, when you need different point of view to look on a problem, to uncover bottlenecks and identify where and why a process doesn't work, for acceleration a process when traditional ways of problem solving consume many time.
Use a Fishbone Diagram to Attack Complex Problems

Use ConceptDraw PRO diagramming software with Fishbone Diagrams Solution to attack any complex problems with fishbone diagrams graphic method. Construct Fishbone diagram to help users brainstorm and break down a complex problem.
Preventive Action
 - Minimization-of-material-wastage")
Skilled use of these diagrams makes collaborative teamwork both more engaging and more effective.
How Do Fishbone Diagrams Solve Manufacturing Problems

ConceptDraw PRO application extended with Fishbone Diagrams solution lets you construct Fishbone diagrams and represent globally recognized standards for manufacturing 6 Ms and 8 Ms.
Using Fishbone Diagrams for Problem Solving

Using Fishbone Diagrams for Problem Solving is a productive and illustrative tool to identify the most important factors causing the trouble. ConceptDraw PRO extended with Fishbone Diagrams solution from the Management area of ConceptDraw Solution Park is a powerful tool for problem solving with Fishbone Ishikawa diagram graphic method.
 PM Response
This solution extends all ConceptDraw Office 2.0 products by helping to improve the response time to project changes. PM Response also helps with iteration planning, discussing project layout approaches, and solving project challenges.
Root Cause Analysis

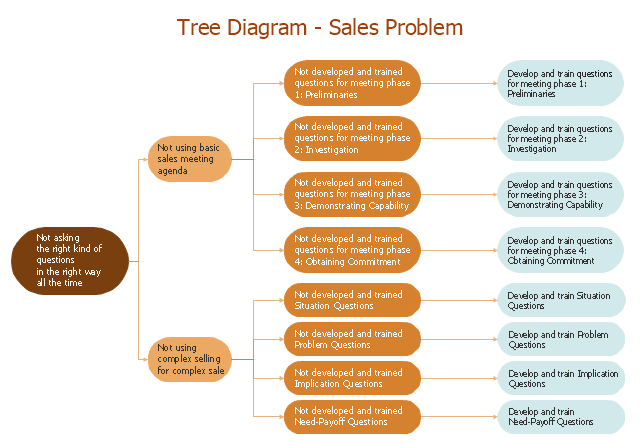
Analyze the root causes for factors that influenced the problem. This diagram is constructed separately for each highly prioritized factor. The goal of this is to find the root causes for the factor and list possible corrective action.
"Root cause analysis (RCA) is a method of problem solving that tries to identify the root causes of faults or problems. ...
RCA (in steps 3, 4 and 5) forms the most critical part of successful corrective action, because it directs the corrective action at the true root cause of the problem. Knowing the root cause is secondary to the goal of prevention, but without knowing the root cause, it is not possible to determine what an effective corrective action for the defined problem would be. ...
3. Ask "why" and identify the causes associated with each step in the sequence towards the defined problem or event. "Why" is taken to mean "What were the factors that directly resulted in the effect?"
4. Classify causes into causal factors that relate to an event in the sequence and root causes, that if eliminated, can be agreed to have interrupted that step of the sequence chain.
5. Identify all other harmful factors that have equal or better claim to be called "root causes." If there are multiple root causes, which is often the case, reveal those clearly for later optimum selection." [Root cause analysis. Wikipedia]
This root cause analysis (RCA) tree diagram example "Sale problem solution" was created using the ConceptDraw PRO diagramming and vector drawing software extended with the Seven Management and Planning Tools solution from the Management area of ConceptDraw Solution Park.
RCA diagram
Improving Problem Solving and Focus with Fishbone Diagrams

ConceptDraw PRO extended with Fishbone Diagrams solution gives a powerful tool for improving problem solving and focus with Fishbone diagrams.
Decision Making

The Seven Management and Planning Tools is a set for such diagrams: Affinity Diagram, Relations Diagram, Prioritization Matrix, Root Cause Tree Diagram, Involvement Matrix, PERT Chart, Risk Diagram (PDPC).
PROBLEM ANALYSIS. Root Cause Analysis Tree Diagram

ConceptDraw Office suite is a software for problem analysis.
The Action Plan

ConceptDraw Office suite is a software for decision making and action plan.
- Entity-Relationship Diagram (ERD) | PROBLEM ANALYSIS ...
- PROBLEM ANALYSIS Prioritization Matrix | Business Productivity ...
- PROBLEM ANALYSIS Relations Diagram | PROBLEM ANALYSIS ...
- PROBLEM ANALYSIS Identify and Structure Factors | PROBLEM ...
- Using Fishbone Diagrams for Problem Solving | Business ...
- Fishbone Diagrams
- PROBLEM ANALYSIS Relations Diagram | Relationships Analysis ...
- Business Productivity Diagramming | Using Fishbone Diagrams for ...
- Cause and Effect Analysis (Fishbone Diagrams ) | Using Fishbone ...
- Business Productivity Diagramming | Total Quality Management with ...
- Business Productivity Diagramming | Fishbone Diagram | Business ...
- Seven Management and Planning Tools | PROBLEM ANALYSIS ...
- PROBLEM ANALYSIS Identify and Structure Factors | Cause & Effect ...
- Fishbone Diagram | Business Productivity Diagramming | Business ...
- Fishbone Diagram - Conceptdraw.com
- PROBLEM ANALYSIS Prioritization Matrix
- Fishbone Diagram Software for Design | Business Productivity ...
- Data structure diagram with ConceptDraw PRO | Organizational ...
- Business Process Diagram | Business Diagram Software | Business ...
- Cause and Effect Analysis (Fishbone Diagrams ) | Cause & Effect ...