 Business Diagrams
The Business Diagrams Solution extends ConceptDraw DIAGRAM with an extensive collection of professionally designed illustrative samples and a wide variety of vector stencils libraries, which are the real help for all business-related people, business analysts, business managers, business advisers, marketing experts, PR managers, knowledge workers, scientists, and other stakeholders allowing them to design the bright, neat, expressive and attractive Bubble Diagrams, Circle-Spoke Diagrams, Circular Arrows Diagrams, and Venn Diagrams with different quantity of sets in just minutes; and then successfully use them in documents, reports, statistical summaries, and presentations of any style.
HelpDesk
How to Draw a Circular Arrows Diagram

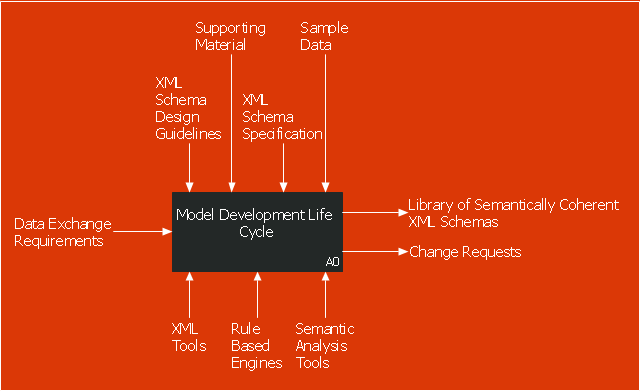
This IDEF0 diagram sample was created on the base of the figure from the website of the Engineering Laboratory of the National Institute of Standards and Technology (NIST). [mel.nist.gov/ msidlibrary/ doc/ kc_ morris/ gsa-final_ files/ image002.gif]
"The systems development life cycle (SDLC), also referred to as the application development life-cycle, is a term used in systems engineering, information systems and software engineering to describe a process for planning, creating, testing, and deploying an information system. The systems development life-cycle concept applies to a range of hardware and software configurations, as a system can be composed of hardware only, software only, or a combination of both." [Systems development life cycle. Wikipedia]
The IDEF0 diagram example "Model development life cycle" was created using the ConceptDraw PRO diagramming and vector drawing software extended with the IDEF0 Diagrams solution from the Software Development area of ConceptDraw Solution Park.
IDEF0 diagram
Process Flowchart


Pie Chart Examples and Templates

 Plan-Do-Check-Act (PDCA)
Plan-Do-Check-Act (PDCA) solution extends the ConceptDraw DIAGRAM software with collection of samples and predesigned vector objects for easy visualization four stages of PDCA cycle, PDSA cycle, or Deming cycle, for illustration effective application of this method to the practical business tasks, for depiction the implementation of changes and solution the problems in business processes. Plan-Do-Check-Act (PDCA) solution helps to design professional-looking and attractive Plan Do Study Act diagrams, PDCA cycle diagrams, PDCA Process diagrams, and to construct the Quality Management Process Models, which all assist to manage efficiently the business processes, to improve quality of work and to reduce significantly the costs.
Basic CCTV System Diagram. CCTV Network Diagram Example

Flow Chart Diagram Examples

 Flowcharts
The Flowcharts solution for ConceptDraw DIAGRAM is a comprehensive set of examples and samples in several varied color themes for professionals that need to represent graphically a process. Solution value is added by the basic flow chart template and shapes' libraries of flowchart notation. ConceptDraw DIAGRAM flow chart creator lets one depict the processes of any complexity and length, as well as design the Flowchart either vertically or horizontally.
BPM Software

The vector stencils library "Glyph icons" contains 38 glyph and symbol UI icons. Use this glyph UI icon set to design graphic user interface (GUI) of your software application for OS X 10.10 Yosemite Apple Mac operating system.
The example "Glyph icons - Vector stencils library" was created using the ConceptDraw PRO diagramming and vector drawing software extended with the Mac OS User Interface solution from the Software Development area of ConceptDraw Solution Park.
The example "Glyph icons - Vector stencils library" was created using the ConceptDraw PRO diagramming and vector drawing software extended with the Mac OS User Interface solution from the Software Development area of ConceptDraw Solution Park.
Check mark grey
Check mark black
Submenu indicator
Command glyph
Add glyph
Delete glyph
Drag vertical glyph
Drag horizontal glyph
Expand corner
Collapse up icon
Collapse down icon
Settings icon
Chevron
Up-down arrows
Divider
Up arrow
Delete key
Key control
Search icon
Search icon 2
All My Files icon
AirDrop icon
iCloud icon
Applications icon
Documents icon
Downloads icon
Desktop icon
Tag - red
Tag - orange
Tag - yellow
Tag - green
Tag - blue
Tag - purple
Tag - gray
All tags
Apple icon
Disclosure triangle
Refresh
Basic Diagramming


 Marketing Diagrams
Marketing Diagrams solution extends ConceptDraw DIAGRAM diagramming software with abundance of samples, templates and vector design elements intended for easy graphical visualization and drawing different types of Marketing diagrams and graphs, including Branding Strategies Diagram, Five Forces Model Diagram, Decision Tree Diagram, Puzzle Diagram, Step Diagram, Process Chart, Strategy Map, Funnel Diagram, Value Chain Diagram, Ladder of Customer Loyalty Diagram, Leaky Bucket Diagram, Promotional Mix Diagram, Service-Goods Continuum Diagram, Six Markets Model Diagram, Sources of Customer Satisfaction Diagram, etc. Analyze effectively the marketing activity of your company and apply the optimal marketing methods with ConceptDraw DIAGRAM software.
Types of Flowcharts


Create Flow Chart on Mac

Data Flow Diagram Model

Sales Process Flowchart. Flowchart Examples

Flow chart Example. Warehouse Flowchart


 Funnel Diagrams
Funnel Diagrams solution including wide range of funnel diagram samples, sales funnel examples, and vector design elements, makes the ConceptDraw DIAGRAM ideal for funnel management and creation the Funnel Diagrams of different types and designs, AIDA Model, AIDAS, ACCA Dagmar, Rossiter-Percy Model, Sales funnel, Marketing funnel, Search funnel, Brand funnel, Purchase funnel, Lead funnel, Conversion funnel, Business funnel, etc. You are free to choose to place your funnel object horizontally or vertically, you can use the objects with desired quantity of sales funnel stages, as well as to modify their size, color filling, and other parameters to make exceptionally looking Funnel diagrams fully responding to your desires.
Process Flow Chart

- Best Program to Make Workflow Diagrams | Biomedical | Model ...
- Model development life cycle - IDEF0 diagram | Circular Arrows ...
- BPR Diagram. Business Process Reengineering Example | Model ...
- Innovation life cycle - Arrow loop diagram | Circular arrows diagram ...
- Proton-proton chain reaction diagram | Operator hierarchy - Natural ...
- Circular diagrams - Vector stencils library | Circular arrows diagrams ...
- Water cycle diagram | BPR Diagram. Business Process ...
- Product life cycle graph | Push Notification Lifecycle Overview ...
- How to Create an IDEF0 Diagram for an Application Development ...
- Butt weld geometry
- Systems development life cycle | SSADM Diagram | Circular Flow ...
- BPM life cycle | Business Process Management | Business Process ...
- Butt weld geometry | Welding - Vector stencils library | Mechanical ...
- Glyph icons - Vector stencils library | Circular diagrams - Vector ...
- Icon Arrow Png
- Arrow circle chart - Template | Program assessment plan - Arrow ...
- Design elements - Text blocks | CMP adaptive management cycle ...
- Invoice lifecycle | Product life cycle graph | Marketing diagrams ...
- Design elements - HR arrows | Design elements - Comparison ...
- IDEF0 Software | How to Create an IDEF0 Diagram for an ...