Best Program to Make Workflow Diagrams

Biomedical

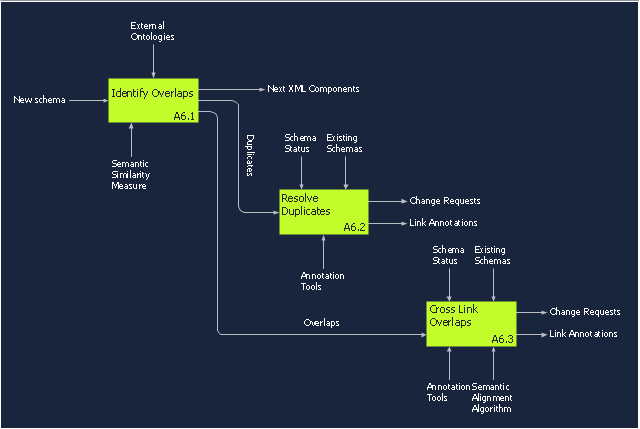
This IDEF0 diagram sample was created on the base of the figure from the website of the Engineering Laboratory of the National Institute of Standards and Technology (NIST). [mel.nist.gov/ msidlibrary/ doc/ kc_ morris/ gsa-final_ files/ image017.gif]
"Model integration is the technology that binds disparate modelling efforts together with the aim to produce a more representative, and therefore more accurate, simulation of the target system. ...
The concept of model integration is central to all systems modelling communities. In complex systems research, where the modelling community often employs a sizeable variety of modelling methodologies, the need for such a model integration technology is vital to understanding the very systems they endeavour to understand." [scs.org/ magazines/ 2011-01/ index_ file/ Files/ Patel_ ED(2).pdf]
The IDEF0 diagram example "Model integration" was created using the ConceptDraw PRO diagramming and vector drawing software extended with the IDEF0 Diagrams solution from the Software Development area of ConceptDraw Solution Park.
IDEF0 diagram
What Is a Concept Map

Process Flowchart


Basic Flowchart Symbols and Meaning


Pyramid Diagram

Technical Flow Chart Example

Flow Chart Symbols

The vector clipart library "Presentation design elements" contains 45 presentation symbols and arrows which you can easy use in your slides and illustrations.
"A presentation is the process of presenting a topic to an audience. It is typically a demonstration, lecture, or speech meant to inform, persuade, or build good will. ... the use of visuals reduced meeting times... audiences believe presenters who use visuals are more professional and credible than presenters who merely speak. ... meetings and presentations reinforced with visuals help participants reach decisions and consensus more quickly." [Presentation. Wikipedia]
The clip art example "Presentation design elements - Vector clipart library" was created in the ConceptDraw PRO diagramming and vector drawing software using the Presentation Clipart solution from the Illustration area of ConceptDraw Solution Park.
Advance Direction Sign

Circuit

Growth

Master Link

Comparison

Plus

Minus

Multiplication

Division

Loupe

Plus sign

Minus sign

Pros and Cons

Balance Lever

Balance

Scientific Research

Business People

Hand

Financial Growth

Wallet

Increase

Decrease

Clock

Mechanism

Interaction

Small Company

Big Company

Company Expansion

Foreign Market Entry

Time

Close Cooperation

Company

Company Merger

Company Extension

Foreign Market Penetration

Business Relations

Profits

Frame 1

Frame 2

Background 1

Background 2

Background 3

Background 4

Background 5

Title block

- Innovation life cycle - Arrow loop diagram | Draw Flowcharts with ...
- BPR Diagram. Business Process Reengineering Example | Model ...
- Model development life cycle - IDEF0 diagram | Circular Arrows ...
- ConceptDraw Arrows10 Technology | How to Add Different ...
- Global liquidity inverted pyramid diagram | Call center network ...
- Business diagrams & Org Charts with ConceptDraw PRO | Federal ...
- Innovation life cycle - Arrow loop diagram | Circular arrows diagram ...
- Phases of the moon | Calendars - Vector stencils library | Stars and ...
- Basic Flowchart Symbols and Meaning | Workflow diagrams - Vector ...