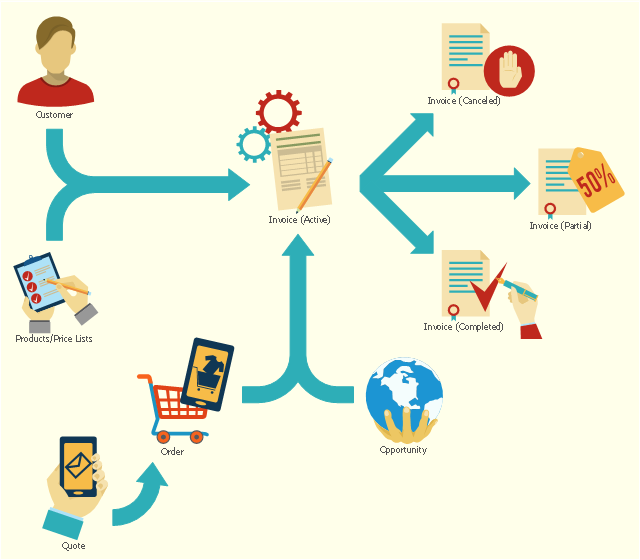
This flowchart example shows the lifecycle of an invoice in Microsoft Dynamics CRM. It was redesigned from the Wikimedia Commons file: Invoice lifecycle.svg. [commons.wikimedia.org/ wiki/ File:Invoice_ lifecycle.svg]
"Microsoft Dynamics CRM is a customer relationship management software package developed by Microsoft. Out of the box, the product focuses mainly on Sales, Marketing, and Service (help desk) sectors...
Dynamics CRM is a server-client application, which, like Microsoft SharePoint, is primarily an IIS-based web application which also supports extensive web services interfaces. Clients access Dynamics CRM either by using a Browser or by a thick client plug-in to Microsoft Outlook." [Microsoft Dynamics CRM. Wikipedia]
The process flowchart example "Invoice lifecycle" was created using the ConceptDraw PRO diagramming and vector drawing software extended with the Sales Flowcharts solution from the Marketing area of ConceptDraw Solution Park.
Lifecycle of an invoice in Microsoft Dynamics CRM
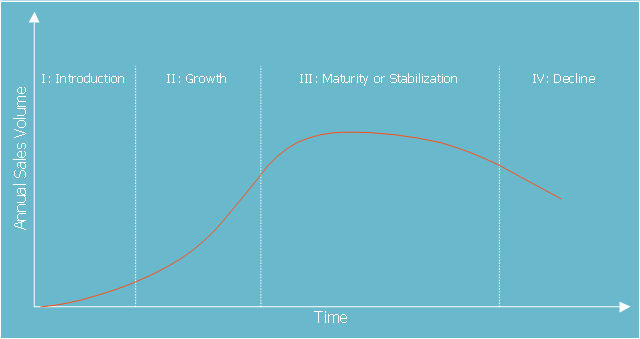
This marketing chart sample represents product life cycle. It was designed on the base of the Wikimedia Commons file: Product life-cycle curve.jpg. [commons.wikimedia.org/ wiki/ File:Product_ life-cycle_ curve.jpg]
This file is licensed under the Creative Commons Attribution-Share Alike 4.0 International license. [creativecommons.org/ licenses/ by-sa/ 4.0/ deed.en]
The marketing chart example "Product life cycle graph" was created using the ConceptDraw PRO diagramming and vector drawing software extended with the Marketing Diagrams solution from the Marketing area of ConceptDraw Solution Park.
Marketing chart
The vector stencils library "Marketing diagrams" contains 12 templates of marketing and sales diagrams and charts. Use it to illustrate your marketing and sales documents, presentations, infographics and webpages in ConceptDraw PRO software extended with Marketing Diagrams solution from Marketing area of ConceptDraw Solution Park.
Diffusion of Innovations

Normal distribution

Five forces model

Leaky bucket diagram

Funnel diagram

Relationship ladder of customer loyalty

Six markets model

Product life cycle graph

Extended product life cycle graph

Service-goods continuum diagram

Step chart block

Step diagram block

This circular arrows diagram sample shows advanced persistent threat lifecycle.
It was designed on the base of the Wikimedia Commons file: Advanced persistent threat lifecycle.jpg.
[commons.wikimedia.org/ wiki/ File:Advanced_ persistent_ threat_ lifecycle.jpg]
This file is licensed under the Creative Commons Attribution-Share Alike 3.0 Unported license. [creativecommons.org/ licenses/ by-sa/ 3.0/ deed.en]
"Advanced Persistent Threat (APT) APT is a set of stealthy and continuous hacking processes often orchestrated by human targeting a specific entity. APT usually targets organizations and or nations for business or political motives. APT processes require high degree of covertness over a long period of time. As the name implies, APT consists of three major components/ processes: advanced, persistent, and threat. The advanced process signifies sophisticated techniques using malware to exploit vulnerabilities in systems. The persistent process suggests that an external command and control is continuously monitoring and extracting data off a specific target. The threat process indicates human involvement in orchestrating the attack.
APT usually refers to a group, such as a government, with both the capability and the intent to persistently and effectively target a specific entity. The term is commonly used to refer to cyber threats, in particular that of Internet-enabled espionage using a variety of intelligence gathering techniques to access sensitive information, but applies equally to other threats such as that of traditional espionage or attack. Other recognized attack vectors include infected media, supply chain compromise, and social engineering. Individuals, such as an individual hacker, are not usually referred to as an APT as they rarely have the resources to be both advanced and persistent even if they are intent on gaining access to, or attacking, a specific target." [Advanced persistent threat. Wikipedia]
The arrow donut chart example
"Advanced persistent threat lifecycle" was created using the ConceptDraw PRO diagramming and vector drawing software extended with the Circular Arrows Diagrams solution from the area "What is a Diagram" of ConceptDraw Solution Park.
Circular arrows diagram

"A Guide to the Project Management Body of Knowledge - Fifth Edition provides guidelines for managing individual projects and defines project management related concepts. It also describes the project management life cycle and its related processes, as well as the project life cycle.
The Guide recognizes 47 processes that fall into five basic process groups and ten knowledge areas that are typical of almost all projects.
The five process groups are:
Initiating,
Planning,
Executing,
Monitoring and Controlling,
Closing.
The ten knowledge areas are:
Project Integration Management,
Project Scope Management,
Project Time Management,
Project Cost Management,
Project Quality Management,
Project Human Resource Management,
Project Communications Management,
Project Risk Management,
Project Procurement Management,
Project Stakeholders Management (added in 5th edition).
Each of the ten knowledge areas contains the processes that need to be accomplished within its discipline in order to achieve an effective project management program. Each of these processes also falls into one of the five basic process groups, creating a matrix structure such that every process can be related to one knowledge area and one process group." [A Guide to the Project Management Body of Knowledge. Wikipedia]
The flow chart example "Project management life cycle" was created using the ConceptDraw PRO diagramming and vector drawing software extended with the Flowcharts solution from the area "What is a Diagram" of ConceptDraw Solution Park.
Flowchart - Project management life cycle

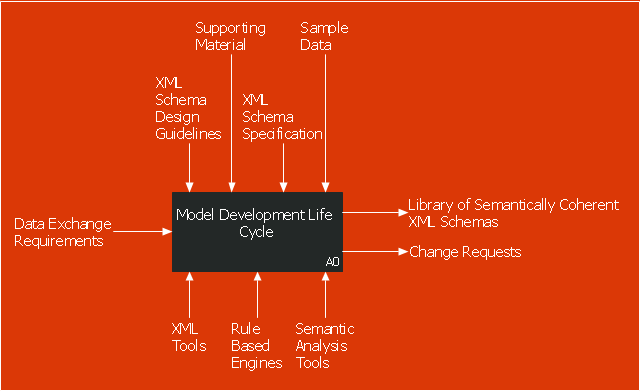
This IDEF0 diagram sample was created on the base of the figure from the website of the Engineering Laboratory of the National Institute of Standards and Technology (NIST). [mel.nist.gov/ msidlibrary/ doc/ kc_ morris/ gsa-final_ files/ image002.gif]
"The systems development life cycle (SDLC), also referred to as the application development life-cycle, is a term used in systems engineering, information systems and software engineering to describe a process for planning, creating, testing, and deploying an information system. The systems development life-cycle concept applies to a range of hardware and software configurations, as a system can be composed of hardware only, software only, or a combination of both." [Systems development life cycle. Wikipedia]
The IDEF0 diagram example "Model development life cycle" was created using the ConceptDraw PRO diagramming and vector drawing software extended with the IDEF0 Diagrams solution from the Software Development area of ConceptDraw Solution Park.
IDEF0 diagram
"Product life cycle is a business analysis that attempts to identify a set of common stages in the life of commercial products. In other words the 'Product Life cycle' PLC is used to map the lifespan of the product such as the stages through which a product goes during its lifespan. ...
The stages of a product's life cycle... :
1. INTRODUCTION... 2. GROWTH... 3. MATURITY... 4. DECLINE...
The product life cycle is an important concept in marketing. It includes four stages that a product goes through from when it was first thought of until it is eliminated from the industry. Not all products reach this final stage. Some continue to grow and others rise and fall." [Product lifecycle. Wikipedia]
The flow chart example "Product life cycle process" was created using the ConceptDraw PRO diagramming and vector drawing software extended with the Flowcharts solution from the area "What is a Diagram" of ConceptDraw Solution Park.
Flowchart - Product life cycle process

This arrow loop cycle diagram sample was created on the base of the figure illustrating the webpage "Exploratory Advanced Research Program Hand-Off Workshops" from the US Department of Transportation - Federal Highway Administration (FHWA) website. "The FHWA’s research and technology innovation life cycle illustrates that research and technology development are not insular activities, but integrated processes that together constitute a system.
Following general workshop discussion, a number of common issues emerged among the groups. These centered around the research life cycle, communicating the value of exploratory advanced research, and continued project funding. It was felt that there is a general need to better describe the research and deployment cycle specific to highway transportation and possibly to highway research fields, such as materials or system planning. Research life cycle diagrams show a very linear, chronological process but it is not necessarily that way in reality." [fhwa.dot.gov/ advancedresearch/ pubs/ 11034/ ]
The arrow loop diagram example "Innovation life cycle" was created using the ConceptDraw PRO diagramming and vector drawing software extended with the Target and Circular Diagrams solution from the Marketing area of ConceptDraw Solution Park.
www.conceptdraw.com/ solution-park/ marketing-target-and-circular-diagrams
Arrow loop cycle diagram
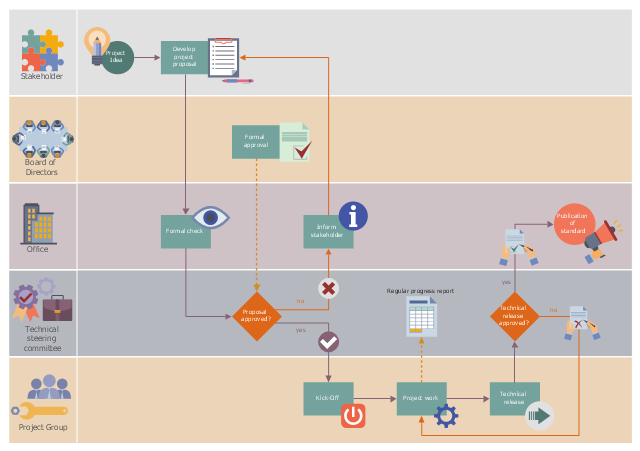
This workflow diagram example was designed on the base of the Wikimedia Commons file: ASAM e.V. flowchart.png.
"Life cycle of an ASAM standard." [commons.wikimedia.org/ wiki/ File:ASAM_ e.V._ flowchart.png]
This file is licensed under the Creative Commons Attribution-Share Alike 3.0 Unported license. [creativecommons.org/ licenses/ by-sa/ 3.0/ deed.en]
"Association for Standardization of Automation and Measuring Systems or ASAM is an incorporated association under German law. Its members are primarily international car manufacturers, suppliers and engineering service providers from the automotive industry. The association coordinates the development of technical standards, which are developed by working groups composed of experts from its member companies. ASAM pursues the vision that the tools of a development process chain can be freely interconnected and allow a seamless exchange of data. The standards define protocols, data models, file formats and application programming interfaces (APIs) for the use in the development and testing of automotive electronic control units." [Association for Standardisation of Automation and Measuring Systems. Wikipedia]
The workflow diagram example "Life cycle of an ASAM standard" was created using ConceptDraw PRO software extended with the Business Process Workflow Diagrams solution from the Business Processes area of ConceptDraw Solution Park.
Workflow diagram
This circular arrows diagram sample shows business process management life cycle.
It was designed on the base of the Wikimedia Commons file: Business Process Management Life-Cycle.svg. [commons.wikimedia.org/ wiki/ File:Business_ Process_ Management_ Life-Cycle.svg]
This file is licensed under the Creative Commons Attribution-Share Alike 3.0 Unported license. [creativecommons.org/ licenses/ by-sa/ 3.0/ deed.en]
"BPM life-cycle.
Business process management activities can be grouped into six categories: vision, design, modeling, execution, monitoring, and optimization.
Functions are designed around the strategic vision and goals of an organization. Each function is attached with a list of processes. Each functional head in an organization is responsible for certain sets of processes made up of tasks which are to be executed and reported as planned. Multiple processes are aggregated to function accomplishments and multiple functions are aggregated to achieve organizational goals." [Business process management. Wikipedia]
The arrow donut chart example "BPM life cycle" was created using the ConceptDraw PRO diagramming and vector drawing software extended with the Circular Arrows Diagrams solution from the area "What is a Diagram" of ConceptDraw Solution Park.
Circular arrows diagram

- Product life cycle graph
- Product life cycle process - Flowchart | Marketing diagrams - Vector ...
- Flowchart - Product life cycle process
- Product life cycle graph - Template
- Marketing diagrams - Vector stencils library | Product life cycle graph ...
- Product life cycle process - Flowchart | Marketing diagrams - Vector ...
- Product life cycle graph | Draw Flowcharts with ConceptDraw ...
- BPM life cycle | Product life cycle process - Flowchart | Life cycle ...
- Graph Of Product Life Cycle
- Product Life Cycle Template Word