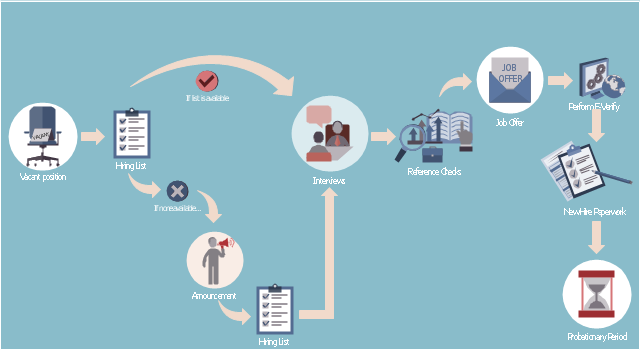
This HR infographics example was designed on the base of flowchart "Hiring Process" from the website of the Idaho Division of Human Resources.
"... hiring process flowchart outlining the steps to fill a vacant position." [dhr.idaho.gov/ hiringprocess.html]
"What is a hiring list and what are they for?
A hiring list consists of applicants who completed and passed the examination for a vacant classified position.
The applicants are ranked on the hiring list in order from highest to lowest score." [dhr.idaho.gov/ PDF%20 documents/ Flowchart/ Hiring%20 List%20 Guidance.pdf]
"Announcements.
Announcing a vacant position benefits the agency by allowing a wide array of applicants the opportunity to compete for job openings, resulting in a more qualified employee. The State Merit System requires all appointments, promotions and separations in the classified service to be based on competence, valid job requirements, and individual performance." [dhr.idaho.gov/ PDF%20 documents/ Flowchart/ Announcement.pdf]
"Conducting A Lawful Employment Interview.
Interviewing prospective employees is one of the most important activities employers do. The employer’s objective of an interview is to determine whether an applicant is suitable for an available position. The interview provides the employer an opportunity to obtain in-depth information about a job applicant’s skills, work history, and employment background for this purpose." [dhr.idaho.gov/ PDF%20 documents/ Flowchart/ Conducting%20 a%20 Lawful%20 Employment%20 Interview.pdf]
"Reference Checks.
References should be checked after a successful interview with a candidate, but before you offer them the position. If after interviewing there are several candidates that are qualified for the position, reference checks are also a way to further distinguish who might best fit within your agency." [dhr.idaho.gov/ PDF%20 documents/ Flowchart/ Reference%20 Checks.pdf]
"Making the job offer.
Before offering the position to your selected candidate, be sure to speak with your HR and fiscal staff. They may have some suggestions for negotiating the starting salary, etc.
Job Offer Letter.
... A job offer letter should be given to the newly hired employee after you have verbally negotiated the terms of employment. This letter confirms the conditions of employment the selected candidate has accepted and gives them information for their first day." [dhr.idaho.gov/ PDF%20 documents/ Flowchart/ Making%20 the%20 job%20 offer.pdf]
"E-verify.
To ensure compliance with the Governor’s Executive Order 2009-10, all
State Agencies are encouraged to participate in E-verify.
E-verify is an internet based system that allows an employer, using information reported on an employee’s Form I-9, to determine the eligibility of that employee to work in the United States.
The E-Verify system is operated by the U.S. Department of Homeland Security in partnership with the Social Security Administration and its use is free of charge to employers." [dhr.idaho.gov/ PDF%20 documents/ Flowchart/ EVerify%20 Statement.pdf]
"New Hire Paperwork.
There are several important forms for the new employee to fill out." [dhr.idaho.gov/ PDF%20 documents/ Flowchart/ New%20 Hire%20 Paperwork.pdf]
"Probationary Period.
All appointments and promotions into classified positions require a probationary period of 1,040 hours
except for peace officers who must serve 2,080 hours.
The probationary period is a working test period to evaluate the work performance of the employee and to determine their suitability for the position." [dhr.idaho.gov/ PDF%20 documents/ Flowchart/ Probationary%20 Period%20 for%20 Hiring%20 Process.pdf]
The HR infographics example "Hiring process workflow" was created using the ConceptDraw PRO diagramming and vector drawing software extended with the HR Flowcharts solution from the Management area of ConceptDraw Solution Park.
HR infographics
IDEF0 standard with ConceptDraw DIAGRAM

Account Flowchart. Flowchart Examples

Process Flowchart


 Manufacturing and Maintenance
Manufacturing and maintenance solution extends ConceptDraw DIAGRAM software with illustration samples, templates and vector stencils libraries with clip art of packaging systems, industrial vehicles, tools, resources and energy.
Organizational Structure Types

KPI Dashboard

Flowcharting Software

Examples of Flowcharts, Org Charts and More


Decision Tree Analysis

The ConceptDraw DIAGRAM diagramming and drawing software is the one that can help with creating the needed drawing, including a decision tree. Making decision tree analysis, it is always easy to make the needed matrix as there are plenty of pre-made templates to be used.
Authority Matrix Diagram Software

Stakeholder Onion Diagrams

SWOT Analysis

Pyramid Diagram

Entity Relationship Diagram Symbols

PDPC

What is SWOT Analysis?

A five level pyramid model of different types of Information Systems based on the information processing requirement of different levels in the organization. The first level represents transaction processing systems to process basic data. The second level represents office support systems to process information in office. The third level represents management information systems to process information by managers. The fourth level represents decision support systems to process explicit knowledge. The fifth level represents executive information systems to process tacit knowledge.
"A Computer(-Based) Information System is essentially an IS using computer technology to carry out some or all of its planned tasks. The basic components of computer based information system are:
(1) Hardware - these are the devices like the monitor, processor, printer and keyboard, all of which work together to accept, process, show data and information.
(2) Software - are the programs that allow the hardware to process the data.
(3) Databases - are the gathering of associated files or tables containing related data.
(4) Networks - are a connecting system that allows diverse computers to distribute resources.
(5) Procedures - are the commands for combining the components above to process information and produce the preferred output.
The first four components (hardware, software, database and network) make up what is known as the information technology platform. Information technology workers could then use these components to create information systems that watch over safety measures, risk and the management of data. These actions are known as information technology services." [Information systems. Wikipedia]
This pyramid diagram was redesigned using the ConceptDraw PRO diagramming and vector drawing software from Wikimedia Commons file Five-Level-Pyramid-model.png. [commons.wikimedia.org/ wiki/ File:Five-Level-Pyramid-model.png]
This file is licensed under the Creative Commons Attribution 3.0 Unported license. [creativecommons.org/ licenses/ by/ 3.0/ deed.en]
The triangle chart example "Information systems types" is included in the Pyramid Diagrams solution from the Marketing area of ConceptDraw Solution Park.
Pyramid diagram

Collaboration in a Project Team

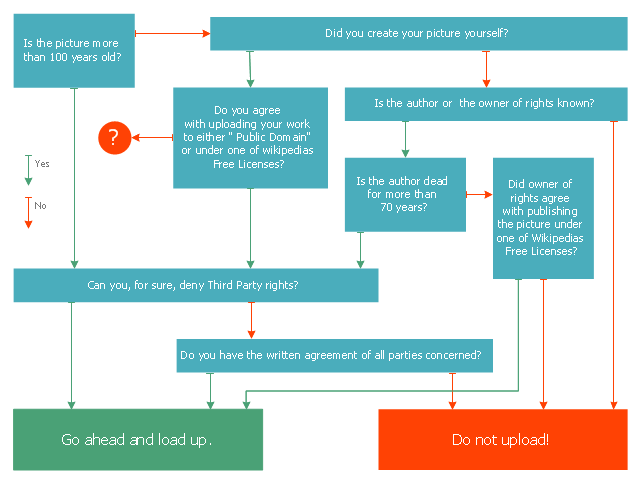
This marketing diagram sample represents decision tree. It was redesigned from the Wikimedia Commons file: Decision Tree on Uploading Imagesv2.svg.
[commons.wikimedia.org/ wiki/ File:Decision_ Tree_ on_ Uploading_ Imagesv2.svg]
"A decision tree is a decision support tool that uses a tree-like graph or model of decisions and their possible consequences, including chance event outcomes, resource costs, and utility. It is one way to display an algorithm.
Decision trees are commonly used in operations research, specifically in decision analysis, to help identify a strategy most likely to reach a goal. ...
A decision tree is a flowchart-like structure in which internal node represents test on an attribute, each branch represents outcome of test and each leaf node represents class label (decision taken after computing all attributes). A path from root to leaf represents classification rules.
In decision analysis a decision tree and the closely related influence diagram is used as a visual and analytical decision support tool, where the expected values (or expected utility) of competing alternatives are calculated.
A decision tree consists of 3 types of nodes:
(1) Decision nodes - commonly represented by squares.
(2) Chance nodes - represented by circles.
(3) End nodes - represented by triangles.
Decision trees are commonly used in operations research, specifically in decision analysis, to help identify a strategy most likely to reach a goal." [Decision tree. Wikipedia]
The marketing diagram example "Decision tree" was created using the ConceptDraw PRO diagramming and vector drawing software extended with the Marketing Diagrams solution from the Marketing area of ConceptDraw Solution Park.
Marketing flowchart
- Draw A Flow Chart Diagram On Classification Of Resources
- Classification Of Natural Resources With Flow Chart Pdf
- How to Plan and Allocate Resources in Your Project with ...
- Draw A Flow Chart To Show How Are Resources Are Classified
- Draw A Flowchart Showing Classification Of Resources
- Chart On Classification On Resources
- Classify The Natural Resources In Flowchart
- Prepare A Chart Of Classification Of Resources With A Suitable
- Prepare Chart Showing The Classification Of Resources
- How to Create a Cross Functional Flow Chart | Collaboration in a ...
- Flow Chart On Classification Of Resources
- Flow Chart Showing Classification Of Resources
- Human Resources | Electronic human resources (E-HR) | Human ...
- Classification Of Resources In A Web Chart
- Make A Flow Chart Of Classify Natural Resources
- Resources Flow Chart
- SYSML | Flow Chart Showing Different Types Of Resources With ...
- Types of Flowcharts | Flow Chat Classification Of Natural Resources ...
- Prepare Achart Showing The Classification Of Resources
- Draw A Flow Chart To Show Resource Are Classified