Technical Flow Chart

Pyramid Diagram

 Vehicular Networking
The Vehicular Networking solution extends the ConceptDraw DIAGRAM software functionality with specialized tools, wide variety of pre-made vector objects, collection of samples and templates in order to help network engineers design vehicular network diagrams for effective network engineering activity, visualize vehicular networks, develop smart transportation systems, design various types of vehicle network management diagrams, regional network diagrams, vehicular communication system diagrams, vehicular ad-hoc networks, vehicular delay-tolerant networks, and other network engineering schemes.
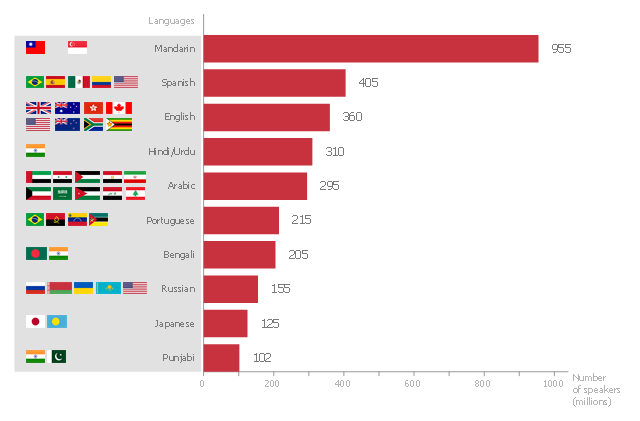
This bar graph sample shows the number of speakers for the most spoken languages of the world.
"In the philosophy of language, a natural language (or ordinary language) is any language which arises in an unpremeditated fashion as the result of the innate facility for language possessed by the human intellect. A natural language is typically used for communication, and may be spoken, signed, or written. Natural language is distinguished from constructed languages and formal languages such as computer-programming languages or the "languages" used in the study of formal logic, especially mathematical logic. ... Though the exact definition varies between scholars, natural language can broadly be defined in contrast on the one hand to artificial or constructed languages, computer programming languages like Python and international auxiliary languages like Esperanto, and on the other hand to other communication systems in nature, such as the waggle dance of bees. Although there are a variety of natural languages, any cognitively normal human infant is able to learn any natural language. By comparing the different natural languages, scholars hope to learn something about the nature of human intelligence and the innate biases and constraints that shape natural language, which are sometimes called universal grammar. The term "natural language" refers only a language that has developed naturally, and hence to actual speech, rather than prescribed speech. Hence, unstandardized speech (such as African American Vernacular English) is natural, whereas standardized speech such as Standard American English, which is in part prescribed, is somewhat artificial." [Natural language. Wikipedia]
The horizontal bar chart example "The most spoken languages of the world" was created using the ConceptDraw PRO diagramming and vector drawing software extended with the Bar Graphs solution from the Graphs and Charts area of ConceptDraw Solution Park.
Horizontal bar graph
 Telecommunication Network Diagrams
Telecommunication Network Diagrams solution extends ConceptDraw DIAGRAM software with samples, templates, and great collection of vector stencils to help the specialists in a field of networks and telecommunications, as well as other users to create Computer systems networking and Telecommunication network diagrams for various fields, to organize the work of call centers, to design the GPRS networks and GPS navigational systems, mobile, satellite and hybrid communication networks, to construct the mobile TV networks and wireless broadband networks.
Process Flow Chart

Flowchart on Bank. Flowchart Examples


Processing Flow Chart

ConceptDraw DIAGRAM enhanced with Flowcharts Solution from the "Diagrams" Area of ConceptDraw Solution Park is a powerful Processing Flow Chart software which will help save lots of your time.
 Interactive Voice Response Diagrams
Interactive Voice Response Diagrams solution extends ConceptDraw DIAGRAM software with samples, templates and libraries of ready-to-use vector stencils that help create Interactive Voice Response (IVR) diagrams illustrating in details a work of interactive voice response system, the IVR system’s logical and physical structure, Voice-over-Internet Protocol (VoIP) diagrams, and Action VoIP diagrams with representing voice actions on them, to visualize how the computers interact with callers through voice recognition and dual-tone multi-frequency signaling (DTMF) keypad inputs.
Why Flowchart Important to Accounting Information System?

Accounting Flowchart Symbols

Types of Flowcharts


SDL Flowchart Symbols

Flow Chart Online

Diagramming Software for Design UML Communication Diagrams


Project —Task Trees and Dependencies

UML Flowchart Symbols

Process Flow Diagram

Credit Card Order Process Flowchart. Flowchart Examples

Flow chart Example. Warehouse Flowchart


- Flow Chart Of Communication System
- Explain Various Components Of Data Communication System With ...
- Flow Chart Diagram For Wireless Communication System
- Flow Chart Of Communication System In Tourism
- Simple Communication System Chart
- Flow Chart Of Radio Communication
- Draw The Block Diagram Of Digital Communication System
- Flow Chart Of Analog Communication System
- Inter-vehicle communication systems | Vehicular Networking ...
- Drawing The Communication Chart
- Layout Diagram Of Wireless Communication Systems
- Components Of Communications Flow Chart
- Transport And Communication Flow Chart
- Flow Chart Of Satellite Communication
- Flow Chart Of Telecommunication
- Process Flowchart | Cross-Functional Flowchart | Basic Flowchart ...
- Diagram And Pie Chart For Wireless Communication
- Data Flow Diagram For Mobile Communication
- Flowchart For Wireless Communication
- Flow Chart For Communication Between All Stakeholders That Will