 Computer and Network Package
Computer and Network Package is a large set of valuable graphical solutions from ConceptDraw Solution Park, developed and specially selected to help computer network specialists and IT professionals to realize their daily work the most efficiently and quickly. This package contains extensive set of graphic design tools, ready-to-use vector elements, built-in templates and samples for designing professional-looking diagrams, charts, schematics and infographics in a field of computer network technologies, cloud computing, vehicular networking, wireless networking, ensuring networks security and networks protection. It is useful for designing different floor plans and layout plans for homes, offices, hotels and instantly construction detailed schemes of computer networks and wireless networks on them, for making professional-looking and colorful Pie Charts, Bar Graphs and Line Charts visualizing the relevant information and data.
 Wireless Networks
The Wireless Networks Solution extends ConceptDraw DIAGRAM software with professional diagramming tools, set of wireless network diagram templates and samples, comprehensive library of wireless communications and WLAN objects to help network engineers and designers efficiently design and create Wireless network diagrams that illustrate wireless networks of any speed and complexity, and help to identify all required equipment for construction and updating wireless networks, and calculating their costs.
 Basic Pie Charts
This solution extends the capabilities of ConceptDraw DIAGRAM (or later) with templates, samples, and a library of vector stencils for drawing pie and donut charts.
 Pie Charts
Pie Charts are extensively used in statistics and business for explaining data and work results, in mass media for comparison (i.e. to visualize the percentage for the parts of one total), and in many other fields. The Pie Charts solution for ConceptDraw DIAGRAM offers powerful drawing tools, varied templates, samples, and a library of vector stencils for simple construction and design of Pie Charts, Donut Chart, and Pie Graph Worksheets.
This wheel diagram sample was created on the base of figure illustrating the webpage "Chapter 3: Current State of the Ecosystem" of the website of the National Broadband Plan of US Federal Communications Comission (FCC). "The broadband ecosystem includes applications and content: e-mail, search, news, maps, sales and marketing applications used by businesses, user-generated video and hundreds of thousands of more specialized uses. Ultimately, the value of broadband is realized when it delivers useful applications and content to end-users.
Applications run on devices that attach to the network and allow users to communicate: computers, smartphones, set-top boxes, e-book readers, sensors, private branch exchanges (PBX), local area network routers, modems and an ever-growing list of other devices. New devices mean new opportunities for applications and content.
Finally, broadband networks can take multiple forms: wired or wireless, fixed or mobile, terrestrial or satellite. Different types of networks have different capabilities, benefits and costs.
The value of being connected to the network increases as more people and businesses choose to adopt broadband and use applications and devices that the network supports. Several factors contribute to their decisions. These include whether they can afford a connection, whether they are comfortable with digital technology and whether they believe broadband is useful.
Networks, devices and applications drive each other in a virtuous cycle. If networks are fast, reliable and widely available, companies produce more powerful, more capable devices to connect to those networks. These devices, in turn, encourage innovators and entrepreneurs to develop exciting applications and content. These new applications draw interest among end-users, bring new users online and increase use among those who already subscribe to broadband services. This growth in the broadband ecosystem reinforces the cycle, encouraging service providers to boost the speed, functionality and reach of their networks."
[broadband.gov/ plan/ 3-current-state-of-the-ecosystem/ ]
The circle pie chart example "Forces shaping the broadband ecosystem in the US" was created using the ConceptDraw PRO diagramming and vector drawing software extended with the Target and Circular Diagrams solution from the Marketing area of ConceptDraw Solution Park.
www.conceptdraw.com/ solution-park/ marketing-target-and-circular-diagrams
Wheel diagram

 Computer and Networks Area
The solutions from Computer and Networks Area of ConceptDraw Solution Park collect samples, templates and vector stencils libraries for drawing computer and network diagrams, schemes and technical drawings.
 Vehicular Networking
The Vehicular Networking solution extends the ConceptDraw DIAGRAM software functionality with specialized tools, wide variety of pre-made vector objects, collection of samples and templates in order to help network engineers design vehicular network diagrams for effective network engineering activity, visualize vehicular networks, develop smart transportation systems, design various types of vehicle network management diagrams, regional network diagrams, vehicular communication system diagrams, vehicular ad-hoc networks, vehicular delay-tolerant networks, and other network engineering schemes.
 Telecommunication Network Diagrams
Telecommunication Network Diagrams solution extends ConceptDraw DIAGRAM software with samples, templates, and great collection of vector stencils to help the specialists in a field of networks and telecommunications, as well as other users to create Computer systems networking and Telecommunication network diagrams for various fields, to organize the work of call centers, to design the GPRS networks and GPS navigational systems, mobile, satellite and hybrid communication networks, to construct the mobile TV networks and wireless broadband networks.
 Cisco Network Diagrams
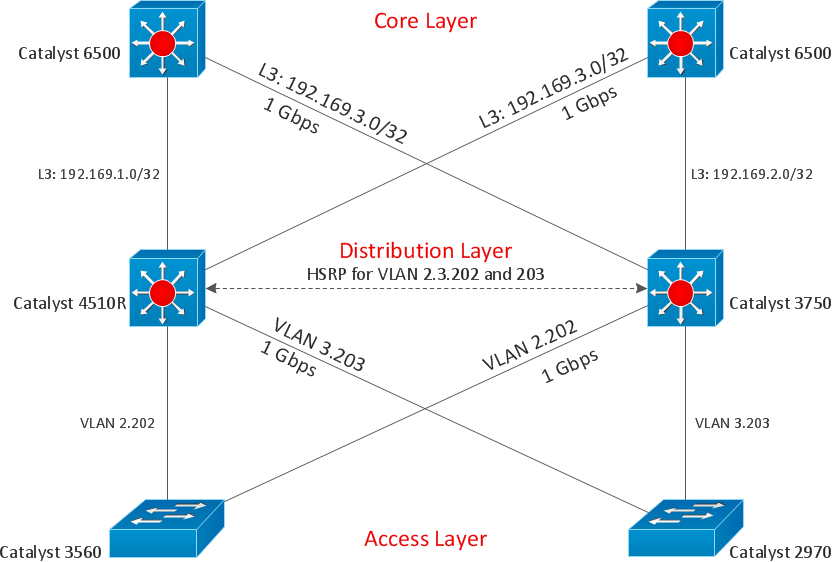
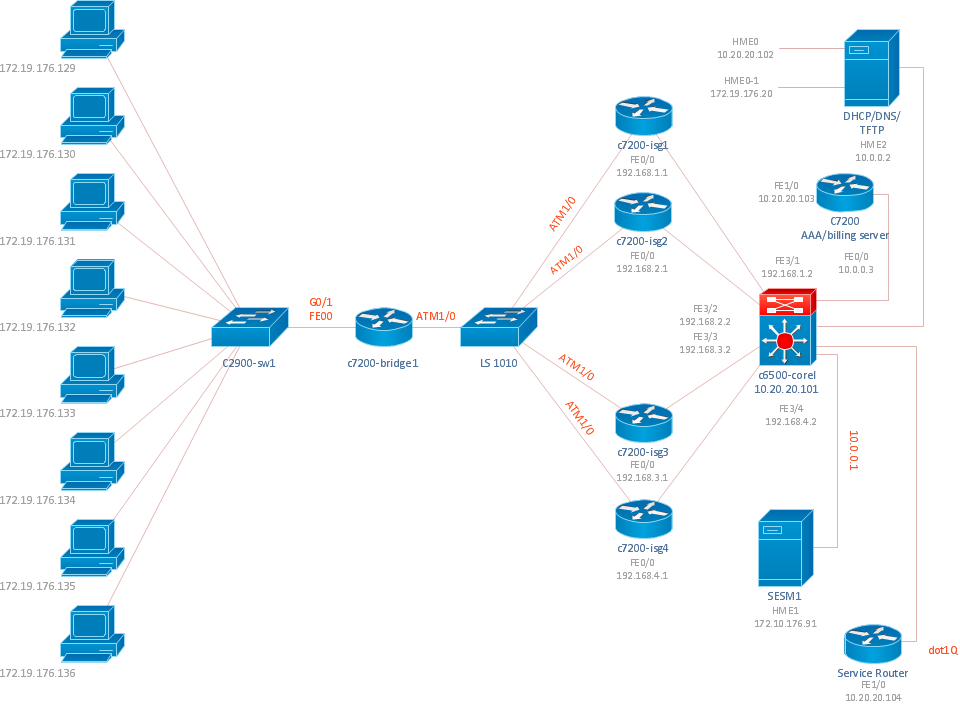
Cisco Network Diagrams solution extends ConceptDraw DIAGRAM with the best characteristics of network diagramming software. Included samples, templates and libraries of built-in standardized vector Cisco network icons and Cisco symbols of computers, network devices, network appliances and other Cisco network equipment will help network engineers, network designers, network and system administrators, as well as other IT professionals and corporate IT departments to diagram efficiently the network infrastructure, to visualize computer networks topologies, to design Cisco computer networks, and to create professional-looking Cisco Computer network diagrams, Cisco network designs and schematics, Network maps, and Network topology diagrams in minutes.
Examples of Flowcharts, Org Charts and More


 Computers and Communications
Computers and communications solution extends ConceptDraw DIAGRAM software with illustration samples, templates and vector stencils libraries with clip art of computers, control devices, communications, technology, Apple machines.
Draw Diagram on Mac
 ConceptDraw Solution Park
ConceptDraw Solution Park collects graphic extensions, examples and learning materials
Diagramming Tool Mac
- Wireless Electricity On Pie Chart Diagram
- Process Flowchart | Pyramid Diagram | Wireless Networks | Pie ...
- Pie Chart Software | ConceptDraw Solution Park | Logistics Flow ...
- Pie chart - Template | Health Food | Wireless Networks | Abundant ...
- Information Transfer Pie Chart Of Food Tree Diagram
- Wireless Communications | Wireless Network Drawing | Digital ...
- Pie Chart Of Telecom Companies
- Adoption Environment Pie Chart
- Business Report Pie. Pie Chart Examples | Line Graph | Flow Chart ...
- Layout Diagram Of Wireless Communication Systems
- Comm Circle Diagram
- Flow Chart Pie Chart Table Graphs Based On Optical Fibres
- Communication Medium Chart
- Wireless broadband network diagram | Illustrate the Computer ...
- Communication Chart Diagram
- Satellite Communication Charts
- Communication medium diagram | How to Create a Social Media ...
- Communication medium diagram | Diagramming Software for ...
- Data Communication And Networking Charts