This site uses cookies. By continuing to browse the ConceptDraw site you are agreeing to our Use of Site Cookies.
HelpDesk

How to Create an Accounting Flowchart

An Accounting flowchart is a specialized type of flowchart. With the help of an accounting flowchart, you can visually describe tasks, documents, people responsible for execution at each stage of the accounting workflow. Find out how you can easily create an accounting flowchart of any complexity using Accounting Flowchart Solution from the ConceptDraw Solution Park.
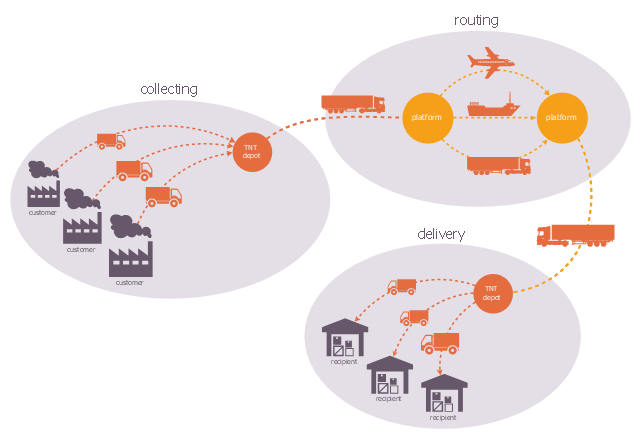
This logistic flow chart sample shows the schematization of the TNT Express integrator characteristics. Clean-up operations, transportation and delivery managed in its own right.
It was designed on the base of the Wikimedia Commons file: TNT Express, un intégrateur mondial. Schéma d'activité.jpg. [commons.wikimedia.org/ wiki/ File:TNT_ Express,_ un_ int%C3%A9grateur_ mondial._ Sch%C3%A9ma_ d%27activit%C3%A9.jpg]
This file is licensed under the Creative Commons Attribution-Share Alike 3.0 Unported license. [creativecommons.org/ licenses/ by-sa/ 3.0/ deed.en]
"TNT Express is an international courier delivery services company with headquarters in Hoofddorp, Netherlands. The firm has fully owned operations in 61 countries and delivers documents, parcels and pieces of freight to over 200 countries." [TNT Express
From Wikipedia]
The logistic flowchart example "Integrator features" was created using ConceptDraw PRO diagramming and vector drawing software extended with the Logistics Flow Charts solution from the Business Processes area of ConceptDraw Solution Park.
Logistic flowchart
Logistic flowchart, warehouse, storage, straight connector, direct connector, shuttle truck, semi-trailer truck, passenger airliner, factory, ellipse, dry cargo ship, circle, arc connector,

Horizontal Flowchart

This sample was created in ConceptDraw DIAGRAM diagramming and vector drawing software using the Flowcharts solution from the Diagrams area of ConceptDraw Solution Park. A Flowchart is a graphically representation of the process, algorithm or the step-by-step solution of the problem. The Flowcharts have one or more starting and ending points. The geometric figures on the Flowcharts represent the steps of the process and are connected with arrows that show the sequence of the actions.

Work Flow Process Chart

Workflow Diagram - workflow process diagram is a visual representation of a organizational process flow. Often it used as the same visual notation as process flow diagram. Visualising business processes using workflow diagram (workflow process diagram) allows estimate business process efficiency, analyse and optimize the process itself. Workflow diagram helps get focusing on each step and relations between workflow steps. ConceptDraw DIAGRAM is software for making workflow diagram. It contains specific designed graphics to draw workflow diagrams effectively. This is workflow diagram maker which do your work process effective.

ConceptDraw Arrows10 Technology

How should diagramming software work? The answer is - Fast and easy. "Tree"- mode drawing works like that. Just select objects in your drawing and press Tree or Chain button to connect all of them just in one click. Your diagram looks professional and it took only a moment to draw.

Business Process Modeling Tools

ConceptDraw DIAGRAM the best business process modeling tools.contains pre-designed libraries and templates based on the BPMN 2.0 standard that allows to create of both simple and complex (nested) models of processes.

The Best Choice for Creating Diagram

Download ConceptDraw diagram software for easy drawing.

Process Flow Diagram Symbols

Chemical and Process Engineering Solution from the Industrial Engineering Area of ConceptDraw Solution Park is a unique tool which contains variety of predesigned process flow diagram symbols for easy creating various Chemical and Process Flow Diagrams in ConceptDraw DIAGRAM.

Marketing Flow Chart

ConceptDraw DIAGRAM diagramming and vector drawing software extended with Marketing Diagrams Solution from the Marketing Area of ConceptDraw Solution Park is the best software for quick and easy creating Marketing Flow Chart of any complexity and design. This charts created to define marketing project stages. In small business project management it sometimes generated by simple marketing project management software. Here is samples which included in Marketing Area of ConceptDraw Solution Park and it can be used as for project planning software as for project management report.

What process should be essentially adopted. Accounting Flowchart Example

The Accounting flowchart shows how information flows from source documents through the accounting records. The are based on the accounting procedures or processes.

Vertical Cross Functional Flowchart

ConceptDraw DIAGRAM is a powerful tool that helps you create professional looking cross-functional flowcharts with the well-designed objects. ConceptDraw DIAGRAM - Drawing Software for Vertical Cross Functional Flowchart. ConceptDraw allows you to focus on work, not the drawing process. ConceptDraw Arrows10 Technology allows to draw connectors with smart behavior that gives flexibility to you during work process.

Concept Mapping

Being usually a very complex process that requires a lot of skills, patience, time, and artistic abilities, the concept mapping process now is incredibly easy thanks to the Concept Maps Solution from the "Diagrams" Area of ConceptDraw Solution Park.

Flowchart design. Flowchart symbols, shapes, stencils and icons

A flowchart is a type of diagram which represents an algorithm, process or workflow, displays the steps as boxes of various kinds and depicts their order by connecting them with arrows. Any business graphic document will be more colorful and understandable if will use professional-looking and visual diagrams and flowcharts. Flowchart design gives versatile presenting and explaining of the process. ConceptDraw DIAGRAM flowchart software enhanced with Flowcharts solution helps effectively make Flowchart Design. Use of predesigned flowchart symbols and bright color palette offers a fresh view and favorably distinguishes the flowcharts designed in ConceptDraw DIAGRAM from the black and white flowcharts on a paper. Preferably to use no more than three or four colors and apply identical for the same shape types. The best flowchart design can be achieved by starting with Flowchart template, or any of suitable ready examples or samples offered in ConceptDraw STORE, open one of them and enter the proper text into each Flowchart shape. Each symbol of the flowchart has a definition that can't be changed. This means that all flowcharts shapes can be grouped in according to their meaning. Users with ConceptDraw DIAGRAM flowchart software can style groups of symbols with close definitions by color sets chosen from complementary palette. Almost all workflows can be depicted as a flowchart. Colored diagrams are more light for perception of the certain information, this is part of flowchart design. Bright colors need to be used in the key points of Decision symbols, to focus attention on their importance for whole process flow.
Business Process Modeling with ConceptDraw
Business Process Modeling with ConceptDraw "Business Process Diagrams" Solution

Network Diagram Software Enterprise Private Network

ConceptDraw - Perfect Network Diagramming Software with abundant examples and templates. ConceptDraw Network Diagram is ideal for network engineers and network designers who need to draw Enterprise Private Network diagrams.

Double-headed Cross Functional Flowchart

ConceptDraw DIAGRAM is a powerful tool that helps you create a Cross Functional Flow Chart quickly and easily. Fine-tuning the objects in ConceptDraw DIAGRAM allows you to create a really professional finished article. ConceptDraw Arrows10 Technology gives drawing connectors a smart behavior that provides quick and precise placement, allows for easy changes and automatic rearrangement.

SDL Flowchart Symbols

Drawing the diagrams we try to find in help the powerful software and now we have the ConceptDraw DIAGRAM. The ability easily create the SDL diagrams is made possible thanks to unique Specification and Description Language (SDL) Solution from the Industrial Engineering Area of ConceptDraw Solution Park. This solution extends ConceptDraw DIAGRAM libraries - SDL Connectors and SDL Diagrams that contain 70 predesigned SDL flowchart symbols.

Accounting Flowchart Symbols

Accounting is a well known and popular tool used for gaining full quantitative information about the finances. The accounting process includes extensive set of activities that begins with transactions and ends with closing of books. It contains all financial information for a given organization, the data about incomes, expenditures, purchases, sales, return, payroll, and many other numerical information. The excellent possibility to create great-looking Accounting Flowcharts is offered by professional ConceptDraw DIAGRAM diagramming and vector drawing software. It includes the Accounting Flowcharts solution containing wide variety of predesigned accounting flowchart symbols. All symbols are easy recognizable, commonly used, vector and professionally designed, so are capable effectively save your time and efforts when representing all stages of accounting work process, the flow of data in an organization, accounting procedures and processes, documents, tasks, responsible people, users, components and authorizations.

Best Flowchart Software and Flowchart Symbols

For many years ConceptDraw Solution Park delivers a great quantity of high-quality business process flowchart and flow diagram solutions, which are turned the ConceptDraw DIAGRAM into the most comprehensive and powerful software. Now it is an example of the best professional flowchart software available with extensive set of solutions, including the Flowcharts solution. The ConceptDraw solutions contain thousands of standard basic and creative flowchart symbols and other design elements, numerous quick-start templates, samples and examples. ConceptDraw DIAGRAM diagramming and vector graphics software includes specific drawing tools that you need to easily design the flowcharts and diagrams of any complexity and degree of detailing. Use ConceptDraw DIAGRAM to draw your own diagrams, charts, graphs and flowcharts for graphic communication, simple visual presentation of complex structures, numerical data and logical relations, explanation business and personal ideas and concepts, representation step-by-step flows of actions or operations, etc.

Percentage Spider Chart

ConceptDraw PRO creates drawings, diagrams and charts with great visual appeal in Mac OS X. This sample shows the Spider Chart that represents the buyer perceptions of the leather footwear industries in Brazil, India and Italy.

Point to Point Network Topology

This sample was created in ConceptDraw DIAGRAM diagramming and vector drawing software using the Computer and Networks solution from Computer and Networks area of ConceptDraw Solution Park. This sample shows the Point-to-point network topology. Network topology is the topological structure of the computer network. Point-to-point network topology is a simple topology that displays the network of exactly two hosts (computers, servers, switches or routers) connected with a cable. Point-to-point topology is widely used in the computer networking and computer architecture.