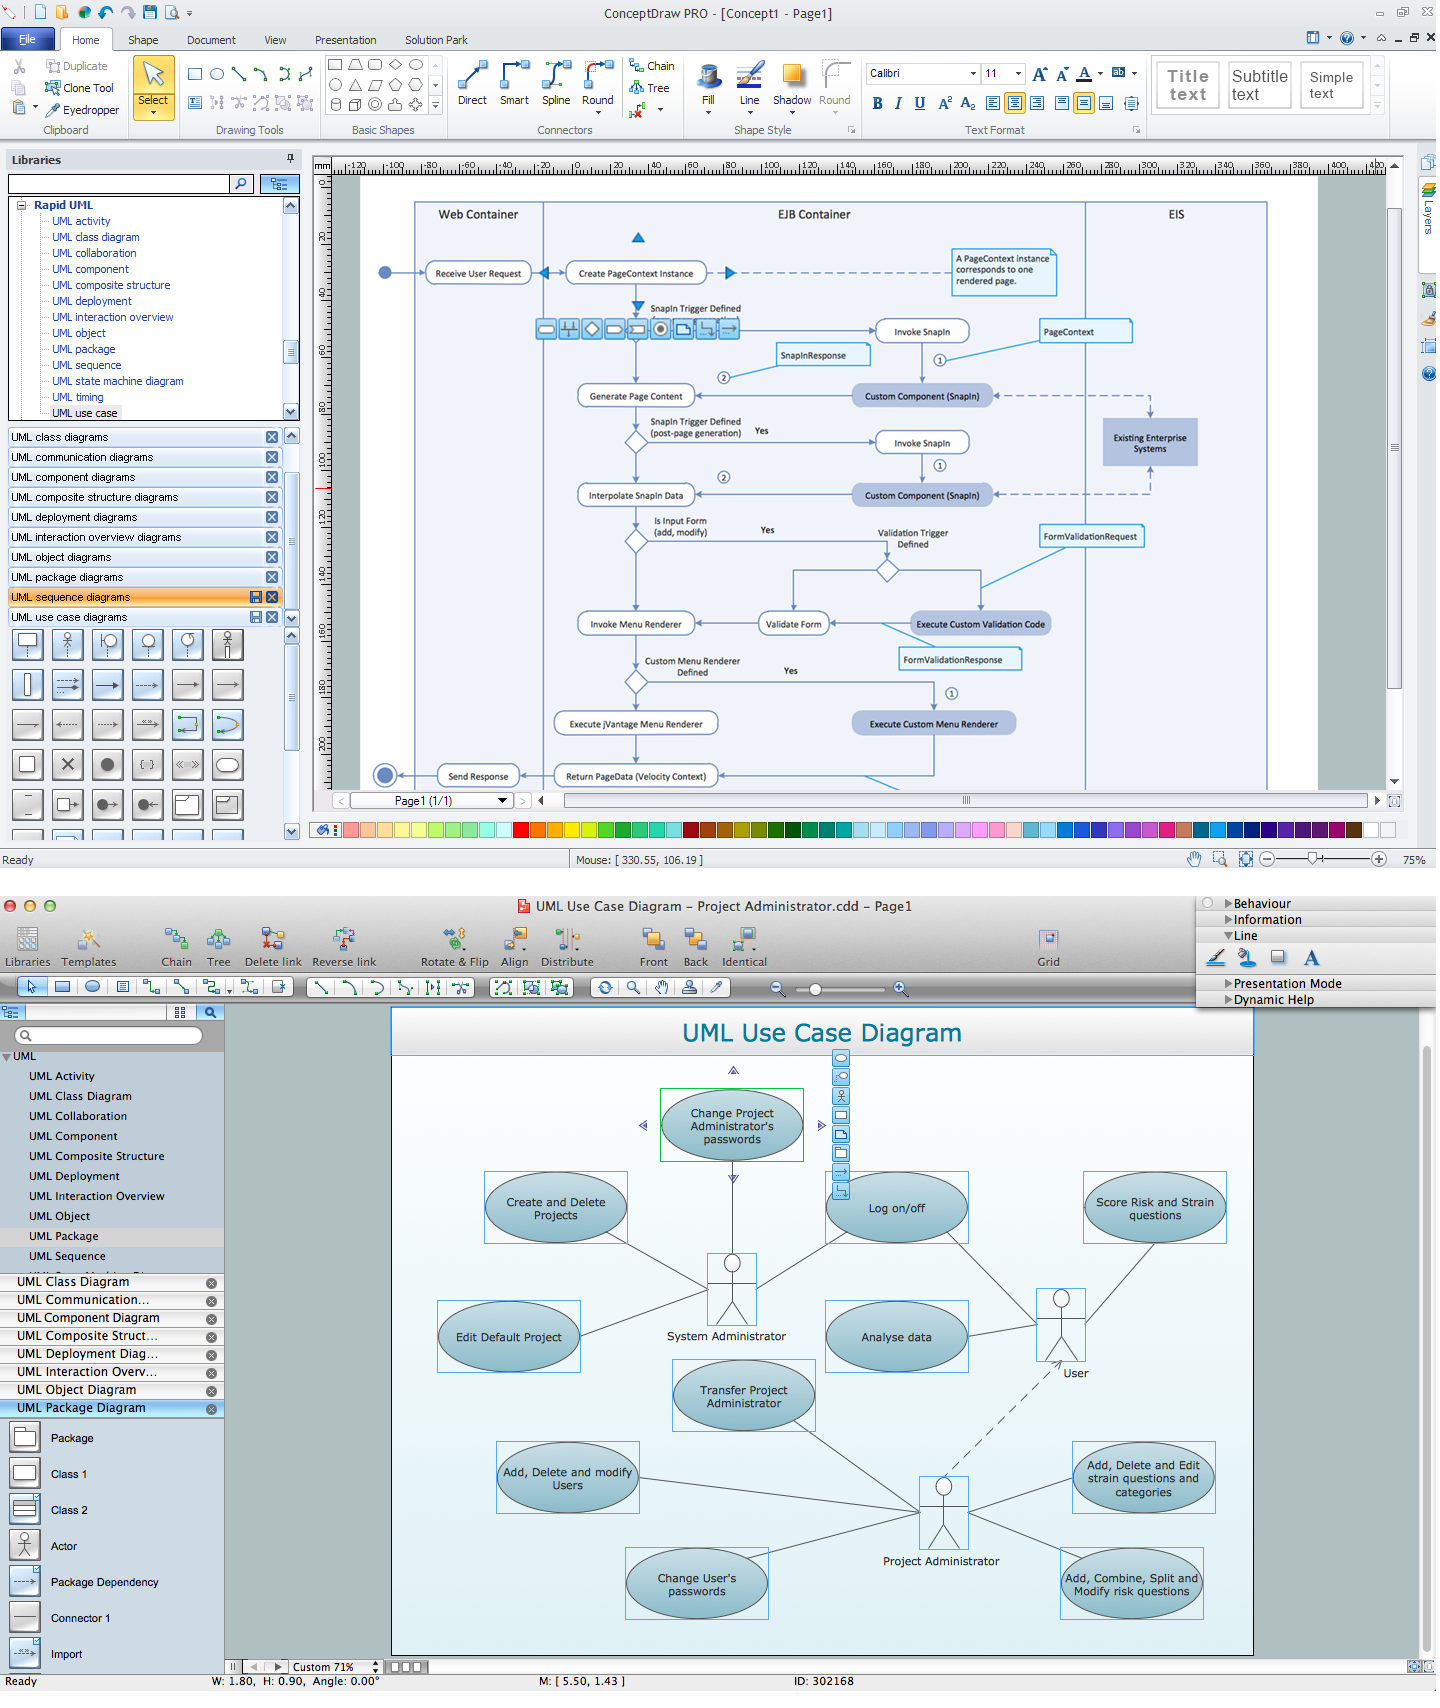
UML Diagram for Mac
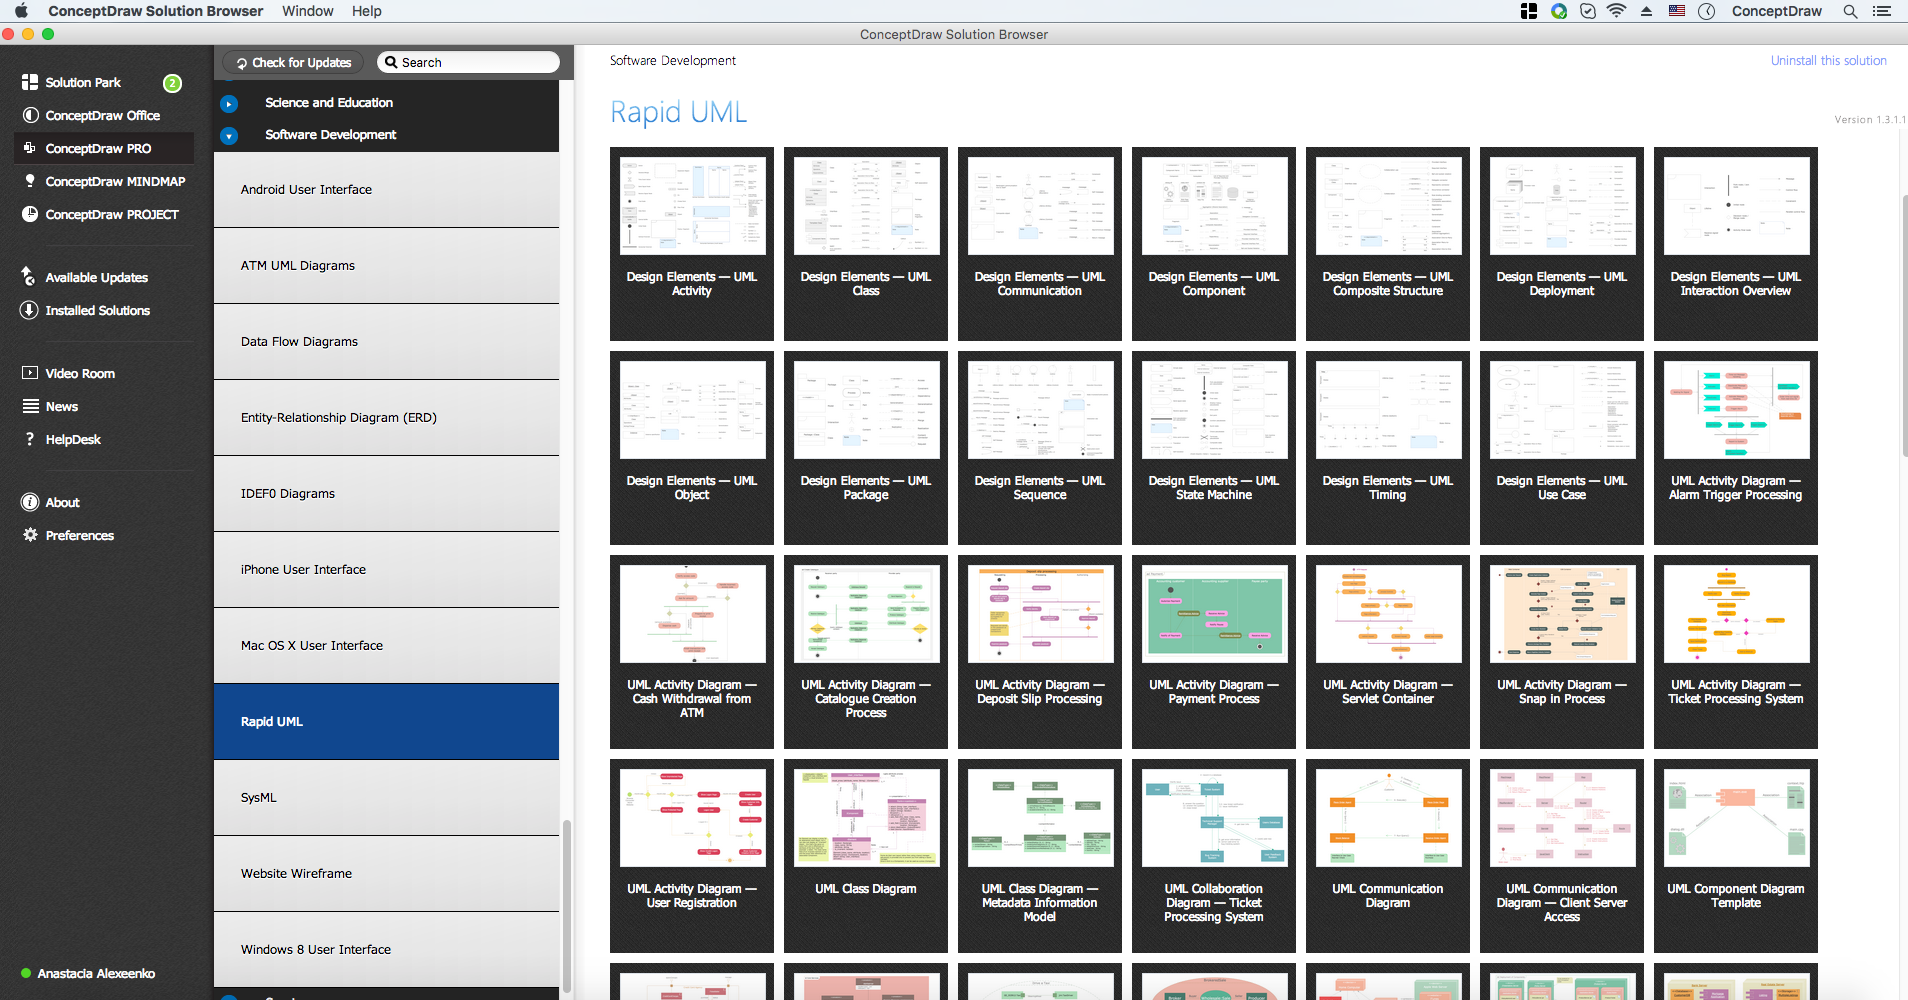
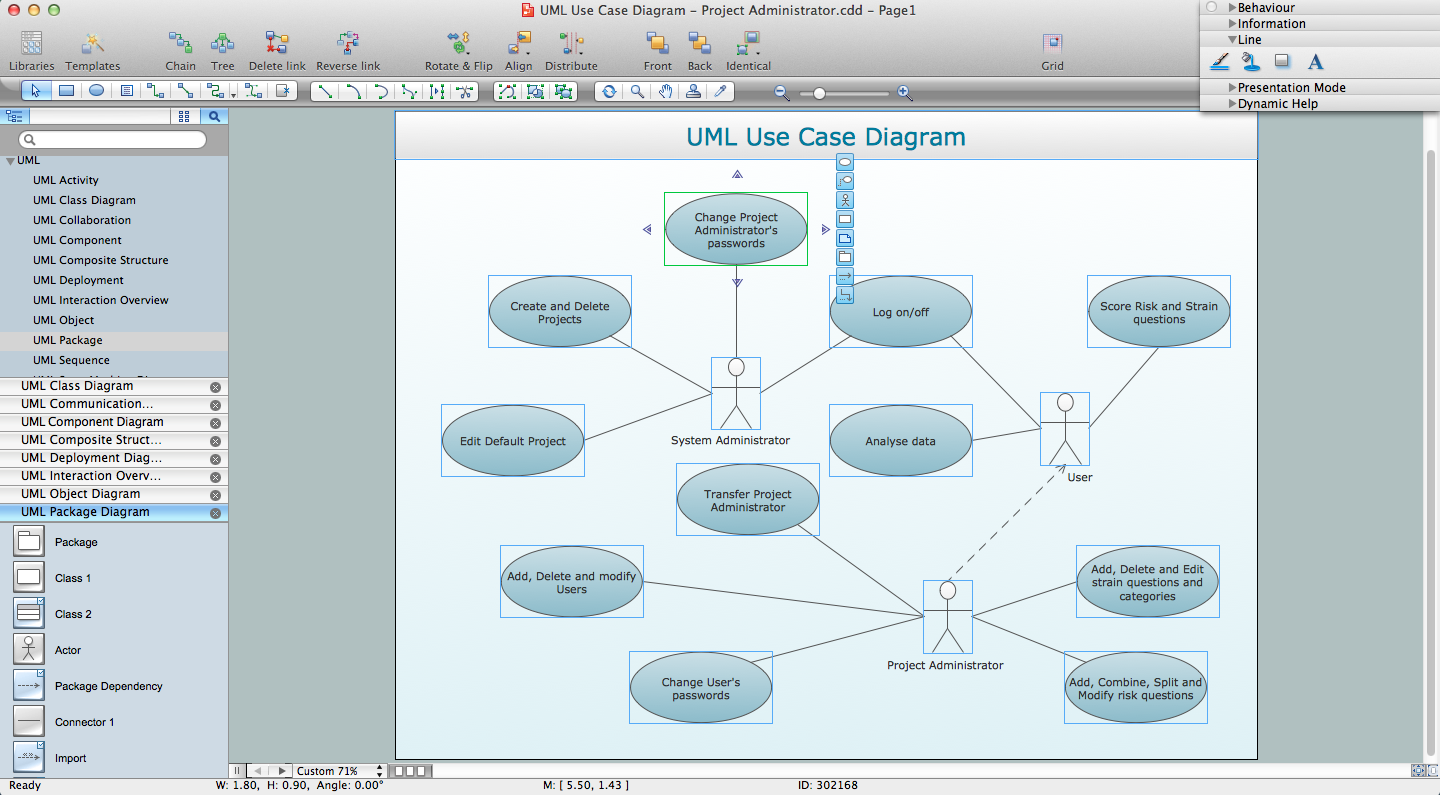
This sample was created on the Mac in ConceptDraw DIAGRAM diagramming and vector drawing software using the UML State Machine Diagram library of the Rapid UML Solution from the Software Development area of ConceptDraw Solution Park.Best Diagramming
Need to draw a diagram, process chart, flowchart, organizational chart, graphic design? ConceptDraw can help you to make professional graphic documents quickly.
UML Deployment Diagram. Diagramming Software for Design UML Diagrams
Deployment diagram describes the hardware used in system implementations and the execution environments and artifacts deployed on the hardware.
UML Component Diagram
UML Component Diagrams are used to illustrate the structure of arbitrarily complex systems and illustrates the service consumer - service provider relationship between components.
Deployment Chart Software
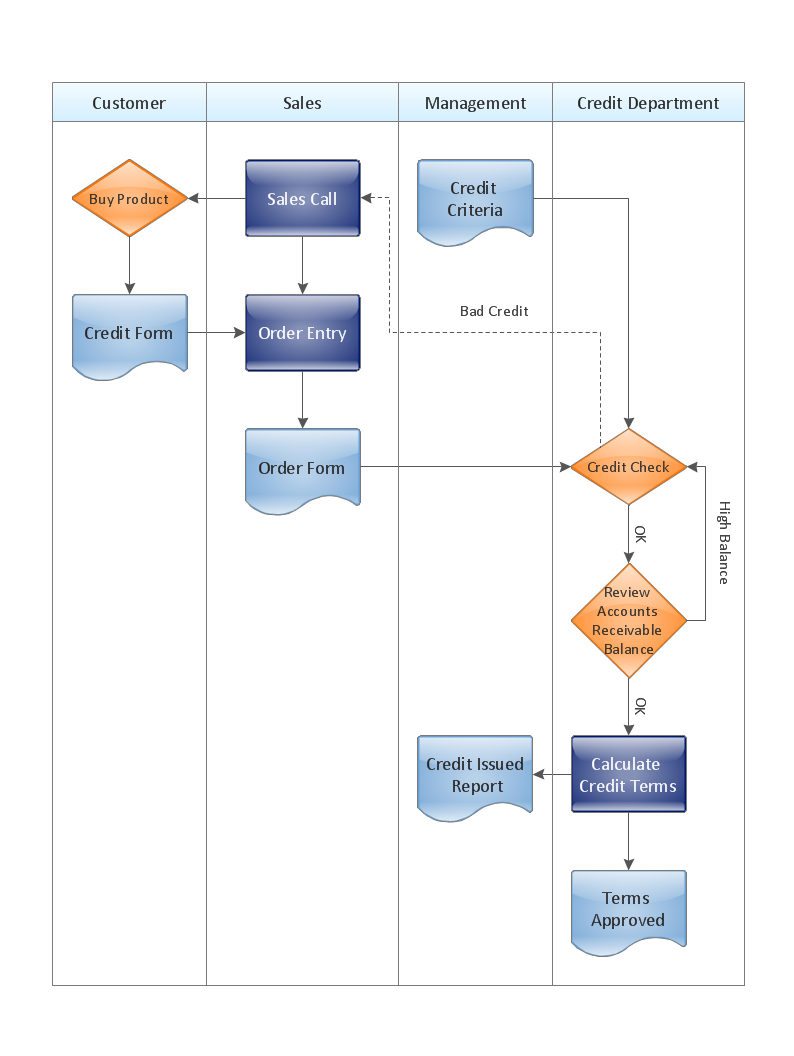
ConceptDraw DIAGRAM extended with Matrices solution from the Marketing area of ConceptDraw Solution Park is the best Deployment Chart Software. The Matrices solution offers you the useful tools for creating Deployment Charts in just minutes. The Deployment Charts designed with ConceptDraw DIAGRAM are vector graphic documents and are available for reviewing, modifying, converting to a variety of formats (image, HTML, PDF file, MS PowerPoint Presentation, Adobe Flash or MS Visio XML), printing and send via e-mail in one moment.UML Diagrams with ConceptDraw DIAGRAM
Unified Modeling Language (UML) is a single modeling language that is used in software engineering to represent effectively the structure of complex computer systems and software. Such visual models in form of UML diagrams allow simplify the process of software development, let to meet the deadlines, improve the final software products, and also facilitate communication process between the customer, system analysts and programmers. The UML language defines standards for operations, methods of programming languages, and their terminology. The main types of UML diagrams are: Activity diagram, Use Case diagram, Deployment diagram, Statechart diagram, Class diagram, Component diagram, Sequence diagram, Collaboration diagram. ConceptDraw DIAGRAM extended with Rapid UML solution is a professional software that provides perfect possibility of easy designing detailed UML diagrams. It offers large number of task-oriented templates and predesigned vector stencils that correspond to standard UML diagram notation. Use them to instantly design the UML diagrams.Online Diagram Tool
ConceptDraw DIAGRAM diagramming and vector drawing software extended with Rapid UML Solution from the Software Development Area is a powerful online diagram tool that will help you design any types of UML diagrams simply and fast.UML for Software Engineers
Unified Modeling Language (UML) is a visual modeling language in the field of software engineering. It is an open standard that provides the graphic notations for creating the visual models of object-oriented software systems. UML took in the notations of the Object-modeling technique, Object-oriented software engineering and the Booch method.Cross-Functional Flowchart - The easiest way to draw crossfunctional
ConceptDraw DIAGRAM diagramming software provides vector shapes and connector tools for quick and easy drawing diagrams for business, technology, science and education. Use ConceptDraw DIAGRAM enhanced with solutions from ConceptDraw Solution Park to create diagrams to present and explain structures, process flows, logical relationships, networks, design schemes and other visually organized information and knowledge.Business Process Modeling Software for Mac
ConceptDraw DIAGRAM - business process modeling software for mac offers the Business Process Diagram Solution with powerful tools to help you easy represent the business processes and create the business process diagrams based on BPMN 1.2 and BPMN 2.0 standards that allows to create of both simple and complex (nested) models of processes.Software development with ConceptDraw products
Internet solutions on ConceptDraw base. What may interest developers of Internet solutions.Example of DFD for Online Store (Data Flow Diagram)
Data Flow Diagram (DFD) is a methodology of graphical structural analysis and information systems design, which describes the sources external in respect to the system, recipients of data, logical functions, data flows and data stores that are accessed. DFDs allow to identify relationships between various system's components and are effectively used in business analysis and information systems analysis. They are useful for system’s high-level details modeling, to show how the input data are transformed to output results via the sequence of functional transformations. For description of DFD diagrams are uses two notations — Yourdon and Gane-Sarson, which differ in syntax. Online Store DFD example illustrates the Data Flow Diagram for online store, the interactions between Customers, Visitors, Sellers, depicts User databases and the flows of Website Information. ConceptDraw DIAGRAM enhanced with Data Flow Diagrams solution lets you to draw clear and simple example of DFD for Online Store using special libraries of predesigned DFD symbols.
Feature Comparison Chart Software
An example of marketing analysis diagram, can be used to analyse product market and define marketing strategy. This sample shows the Feature Comparison Chart of the digital scouting cameras. It can be useful for digital cameras production field, marketing, sales, etc.Entity Relationship Diagram Software for Mac
Great part of modern approaches to the database design are based on the use of different versions of ER-models. The important feature of entity-relationship model is that it can be visually represented as a graphical diagram. ER-models and Entity Relationship Diagrams are so popular due to the simplicity and the presentation clarity. The conceptual basis led to their widespread use in CASE-systems, which support automatic design of relational databases. The typical concepts for ER-models are entity, relation and attribute. Relation is a graphically represented association between two entities, that establishes certain rules and all instances of the linked entity types are subject to these rules. In common ER-model this association is always binary. For representing entity-relationship elements, there are used Crow’s foot and Chen notations. ConceptDraw DIAGRAM is a famous Entity Relationship Diagram software for Mac OSX which gives the ability to describe visually the databases with Chen’s and Crow’s Foot notation icons from Entity-Relationship Diagram (ERD) solution.Diagramming Software for Design UML Activity Diagrams
Activity diagram describes the business and operational step-by-step workflows of components in a system. An activity diagram shows the overall flow of control.
Cisco IBM. Cisco icons, shapes, stencils and symbols
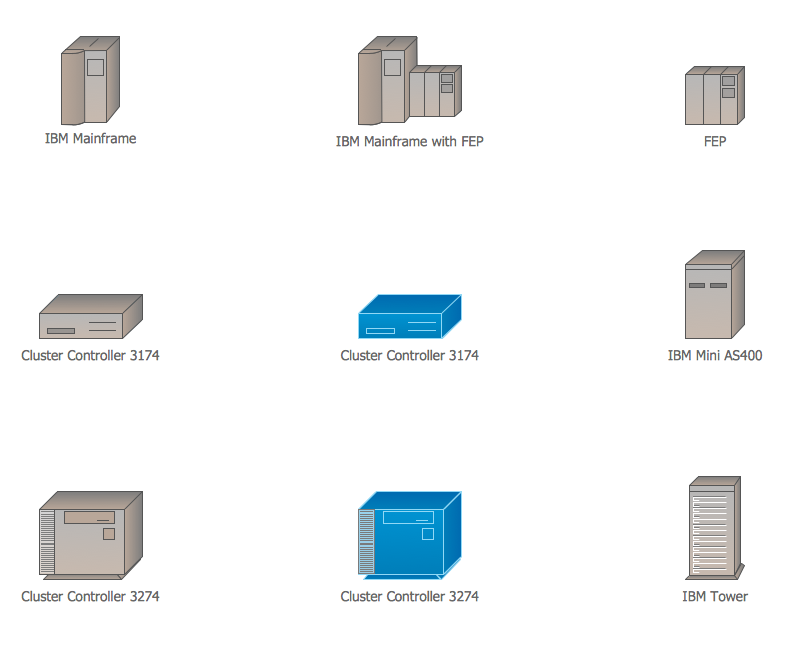
The ConceptDraw vector stencils library Cisco IBM contains equipment symbols for drawing the computer network diagrams.Diagramming Software for Design UML Communication Diagrams
UML Communication Diagram depicts the interactions between objects or parts in terms of sequenced messages and describes both the static structure and dynamic behavior of a system.
Landscape Architecture with ConceptDraw DIAGRAM
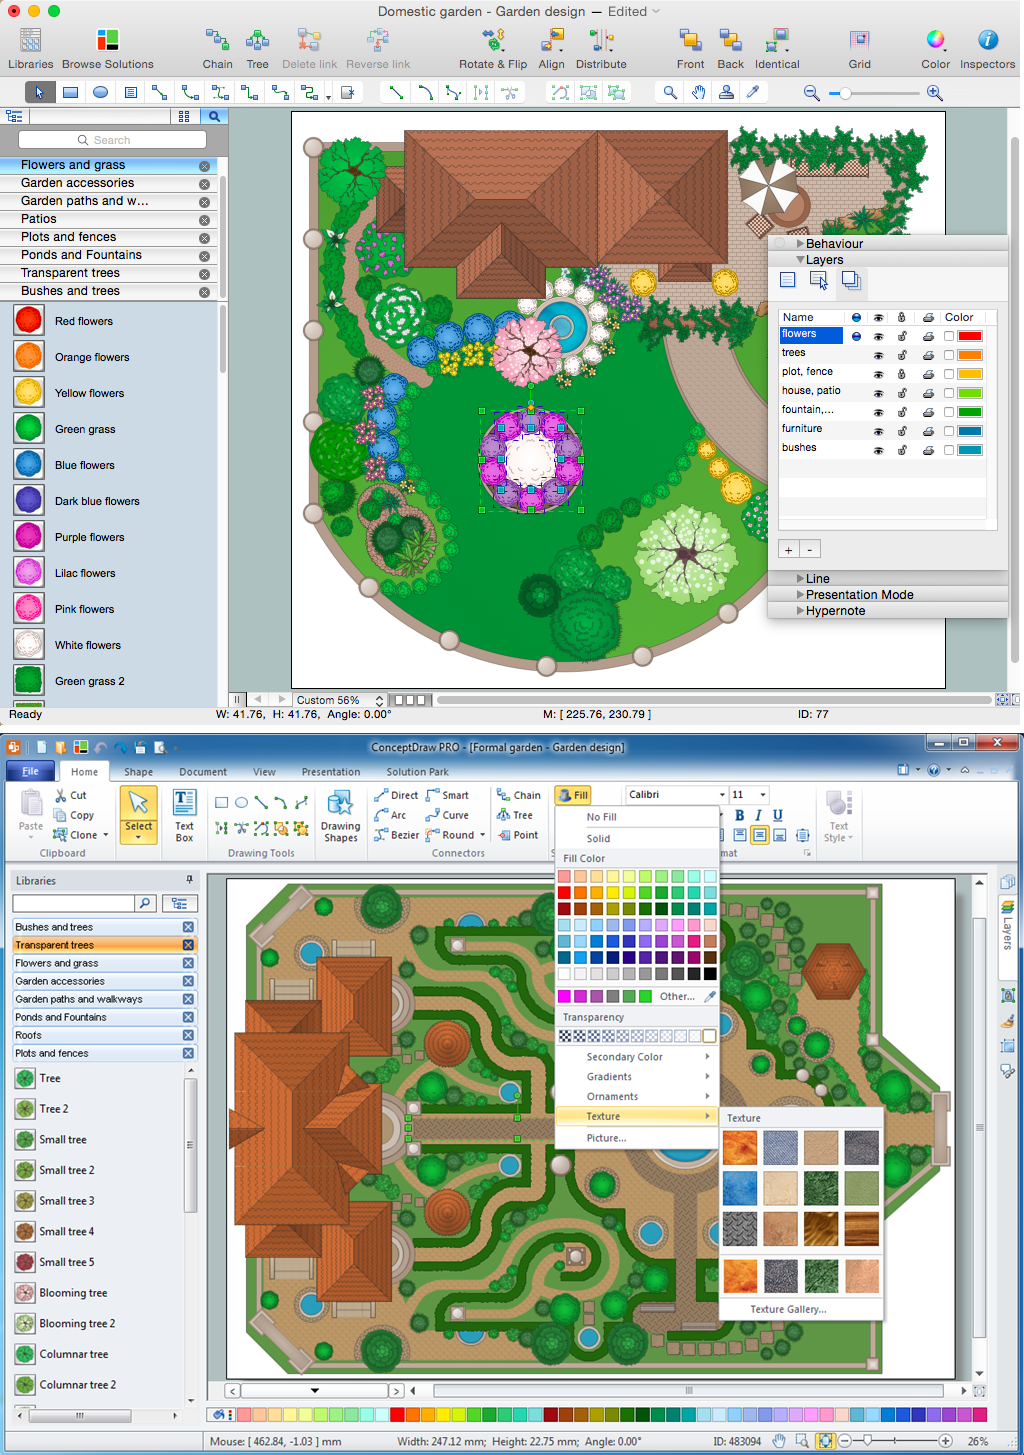
The landscape architecture includes landscape design, planning, and realization, as well as management of resources and buildings. The smaller scale landscape projects are well known as landscape design and garden design. The landscape design documentation is created independently from the project's scale and includes sketches, general plan and working documentation. On this stage the ConceptDraw DIAGRAM software extended with Landscape & Garden solution is irreplaceable assistant for you. The landscape designs created using ConceptDraw DIAGRAM are effectively used by landscape architects and engineers, also by landscape managers who maintain parks, gardens, natural landscapes like woodlands or nature reserves, and artificial landscapes. The Landscape and Garden solution contains 14 libraries with a lot of vector graphics objects of trees, flowers, bushes, fountains, ponds, furniture, roofs, patios, fences, garden accessories, entertainment, roads, junctions, etc., that are suitable for any gardener to simply design a wonderful garden.UML Deployment Diagram. Design Elements
UML Deployment diagram describes the hardware used in system implementations and the execution environments and artifacts deployed on the hardware. ConceptDraw has 393 vector stencils in the 13 libraries that helps you to start using software for designing your own UML Diagrams. You can use the appropriate stencils of UML notation from UML Deployment library.UML Diagramming Software
The UML Diagrams are widely used by software developers and software engineers. They can draw the UML Diagrams manually on the paper, but it is incredibly convenient to use the special UML diagramming software. The UML diagramming software allows you to draw the UML Diagrams in a few minutes.- Deployment flowchart - Trading process diagram | UML Deployment ...
- UML Diagram for Mac | UML Diagrams with ConceptDraw ...
- Deployment chart - Template | Quality function deployment chart ...
- Visio 2016 Deployment Diagram
- UML Deployment Diagram . Diagramming Software for Design UML ...
- State Machine Diagram | UML Use Case Diagram Example ...
- UML Deployment Diagram . Design Elements
- Rapid UML | Software Development | Mac Uml Free
- Deployment Chart Software | Deployment chart - Template | Quality ...
- UML Package Diagram . Design Elements | UML Deployment ...
- UML Deployment Diagram | Design elements - Bank UML ...
- UML Diagram Visio | UML Deployment Diagram . Diagramming ...
- Export from ConceptDraw MINDMAP to Apple iCal | UML ...
- Flowchart Definition | Deployment Chart Software | 25 Typical ...
- UML Deployment Diagram Example - ATM System UML diagrams ...
- How to Design a Mockup of Apple macOS Sierra GUI | Android UI ...
- Diagramming Software for Design UML Interaction Overview ...
- UML Component Diagram | Flowchart Components | UML ...
- Database Diagram Tool | UML Use Case Diagram Example ...
- UML Component for Bank | UML Component Diagram | Banking ...


